


Entity Framework Core (EF Core) has revolutionized the way developers interact with databases in .NET applications, providing a powerful ORM (Object-Relational Mapping) framework that simplifies data access and manipulation. However, understanding the queries EF Core generates under the hood can sometimes be challenging, especially when dealing with complex data models and relationships. This is where EFCore.Visualizer comes into play – a valuable tool for visualizing EF Core queries and gaining insights into their execution.
In this blog post, we’ll deep dive into EFCore.Visualizer, exploring its features, benefits, and how it can aid developers in optimizing their database interactions.
What is EFCore.Visualizer?
EFCore.Visualizer is a debugging tool designed specifically for Entity Framework Core. It integrates seamlessly into Visual Studio, allowing developers to visualize EF Core queries in a clear and understandable manner. By providing a visual representation of the generated SQL queries, EFCore.Visualizer offers insights into the database interactions performed by EF Core within your application.
Key Features of EFCore.Visualizer:
- Visual Representation of Queries: EFCore.Visualizer displays EF Core queries in a visual format, making it easier for developers to understand the underlying database operations. This includes SELECT, INSERT, UPDATE, DELETE, and JOIN operations, among others.
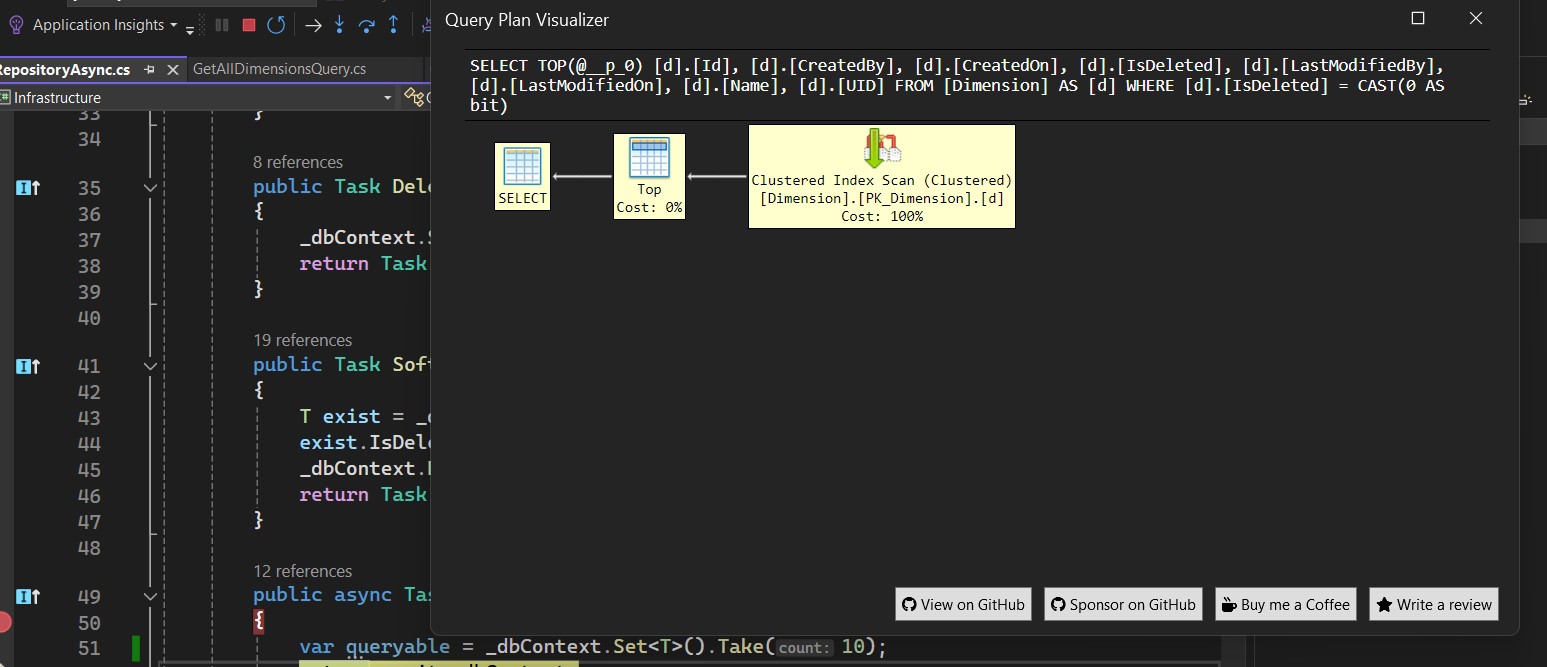
- Query Execution Plan: The tool provides information about the execution plan of each query, highlighting potential performance bottlenecks and areas for optimization. Developers can identify inefficient query patterns and optimize them for better performance.
- Parameter Values: EFCore.Visualizer also shows the parameter values used in the generated SQL queries. This is particularly useful for debugging purposes, as developers can verify the data being passed to the database and ensure its correctness.
- Integration with Visual Studio: As an extension for Visual Studio, EFCore.Visualizer seamlessly integrates into the development environment, providing a familiar interface for developers to work with. This eliminates the need for external tools or plugins, streamlining the debugging process.
- Support for LINQ Queries: EFCore.Visualizer supports both LINQ queries and method-based query syntax, allowing developers to visualize queries written in their preferred style. This flexibility makes it accessible to a wide range of developers, regardless of their querying preferences.
Requirements
The visualizer requires Visual Studio Version 17.9.0 or newer and supports EF Core 7 or newer2.
How to Use EFCore.Visualizer:
Using EFCore.Visualizer is straightforward and requires minimal setup. Here’s a step-by-step guide:
1. Install the EFCore.Visualizer extension from the Visual Studio Marketplace.
2. Open your .NET project in Visual Studio.
3. Set breakpoints in your code where EF Core queries are executed.
4. Run the application in debug mode.
5. When the execution reaches a breakpoint, inspect the EF Core query using EFCore.Visualizer.
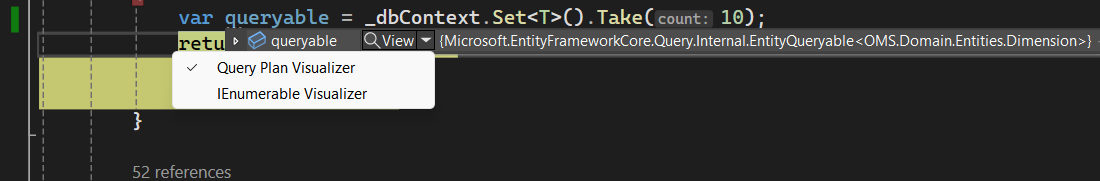
6. Analyze the visual representation of the query, including its execution plan and parameter values.
 7. Make any necessary adjustments to optimize the query performance.
8. Continue debugging or testing your application as needed.
Benefits of EFCore.Visualizer:
- Improved Debugging: EFCore.Visualizer enhances the debugging experience by providing a visual representation of EF Core queries, helping developers identify and resolve issues more efficiently.
- Performance Optimization: By visualizing query execution plans and parameter values, developers can optimize their EF Core queries for better performance, resulting in faster database interactions.
- Increased Productivity: With EFCore.Visualizer integrated into Visual Studio, developers can streamline the debugging process and focus on writing high-quality code, ultimately increasing productivity.
Closure:
EFCore.Visualizer is a valuable tool for developers working with Entity Framework Core, offering insights into the execution of EF Core queries and facilitating debugging and performance optimization. By visualizing the generated SQL queries, developers can gain a deeper understanding of their application’s database interactions and make informed decisions to improve efficiency and performance.
Whether you’re building a new application or maintaining an existing one, EFCore.Visualizer can help you debug EF Core queries with ease and confidence, leading to a smoother development experience and a more robust software solution.