


Hello Readers!! We are again back with an exciting topic i.e K9S. In this blog, we will see all about an attractive Kubernetes dashboard K9S. Firstly let’s see what it is then we will see how we can use this dashboard.
Introduction:
- It is a command-line interface (CLI) based GUI tool which is used for managing Kubernetes clusters.
- K9s is a popular open-source command-line interface (CLI) tool that simplifies the management of Kubernetes clusters.
- It provides a simplified view of Kubernetes resources and offers real-time interaction, cluster status monitoring, and shortcut commands for quick access to observed sources. With K9s, navigating, observing, and managing Kubernetes resources becomes effortless, making it an indispensable tool for anyone looking to optimize their Kubernetes operations.
- It’s a user-friendly interface and unique functionality have made K9s a go-to solution for developers, DevOps engineers, and Kubernetes administrators alike
- K9s is an open-source tool available for free and can be downloaded from GitHub.
Features of the K9S:
- Real-time updates: K9s allows for real-time interaction with Kubernetes resources, ensuring that you always have up-to-date information.
- Cluster status monitoring: K9s continuously monitors the status of your Kubernetes cluster, allowing you to quickly identify and resolve any issues.
- Resource monitoring: K9s continuously monitor the status of your Kubernetes cluster, allowing you to quickly identify and resolve any issues.
- Context switching: K9s support the easiest switching between resources or clusters.
- Multi-cluster support: K9s supports managing multiple Kubernetes clusters, making it a versatile tool for organizations with complex Kubernetes deployments.
Installation:
Download k9s from here according to your need:
https://github.com/derailed/k9s/releases
I have already installed it as you can see below:

Now its time to get hands-on with k9s, to start this simple run k9s on your terminal:

This is the initial dashboard you will find on your terminal that’s why it is called Kubernetes terminal dashboard.
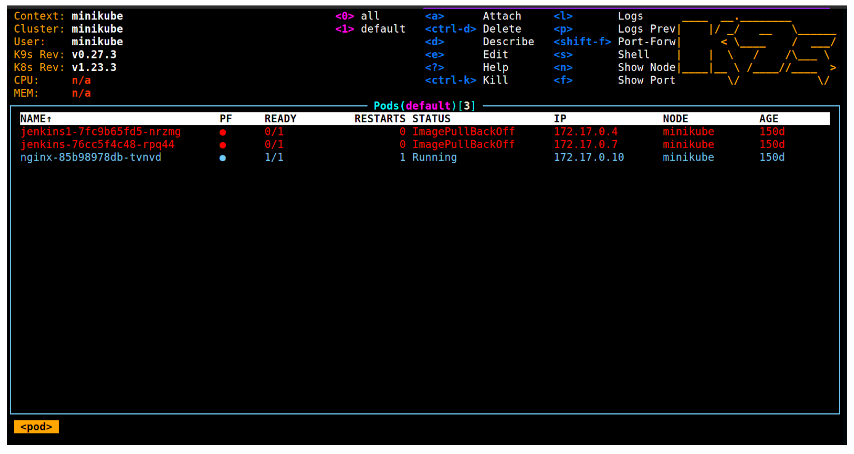
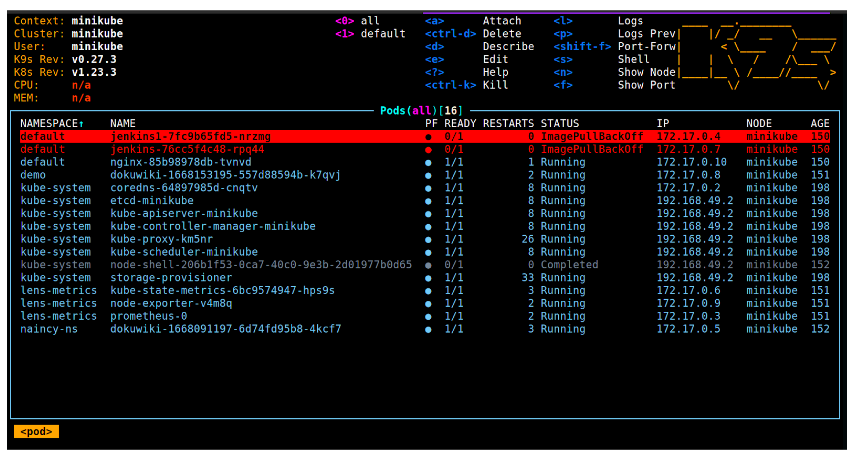
Currently, you can see pods here on the dashboard for the default namespace. To get the list of pods for all namespaces enter 0.
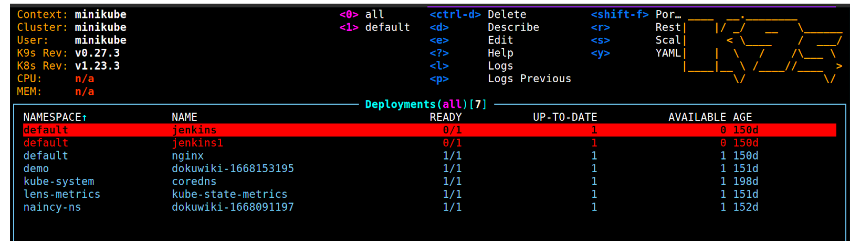
To view deployments, kindly enter: deployments.
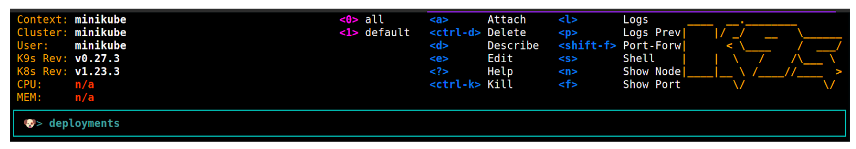
And now you will get the list of deployments.
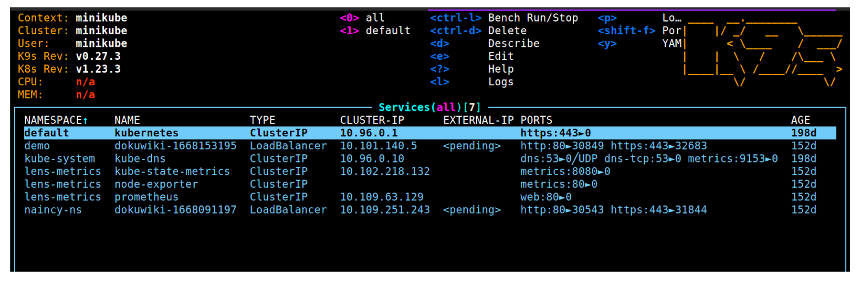
To view services, kindly enter: svc.
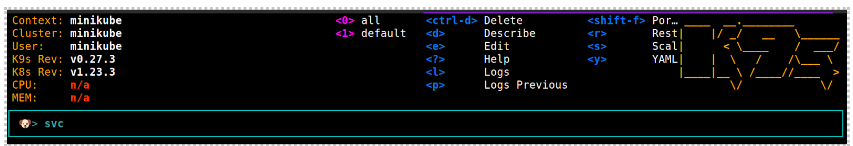
And now you will get the list of services.
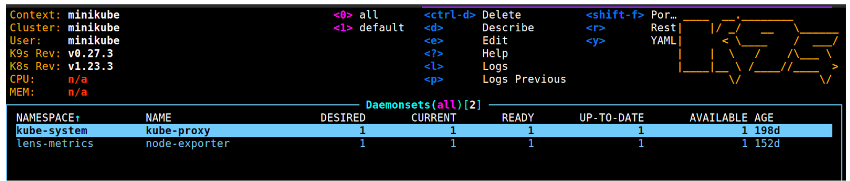
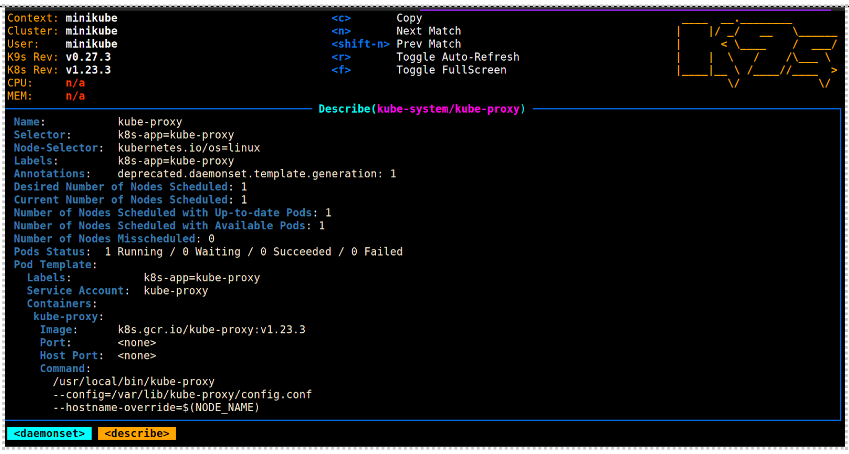
To view daemon sets, kindly enter: daemon sets.
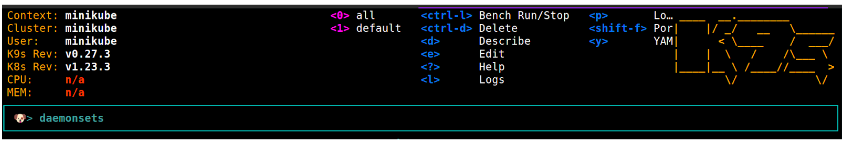
And now you will get the list of daemon sets.
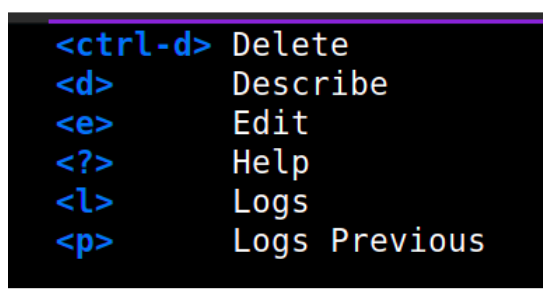
If you want to describe your resources press e.
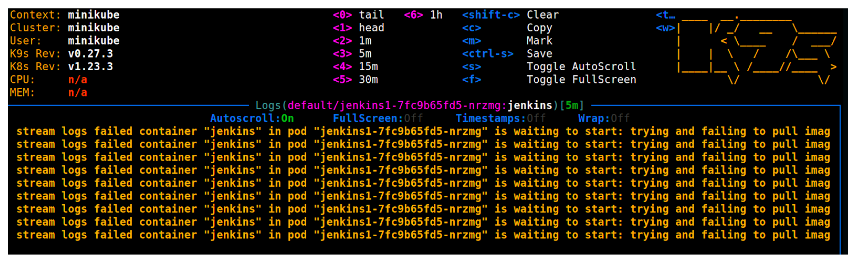
These are the shortcut keys that you can use as per your need like if you want to check logs kindly press l to view that.
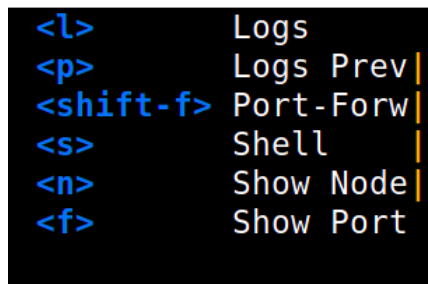
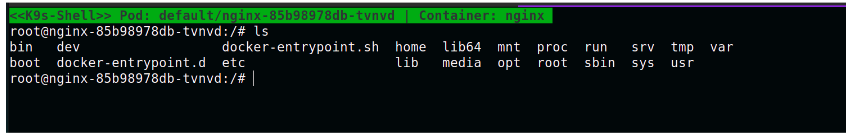
For getting exec into the pod, you only have to press s by selecting the pod:
For getting logs of a pod, we only have to press l by selecting the pod:
Different views:
K9s offer the following view mode that we can use:
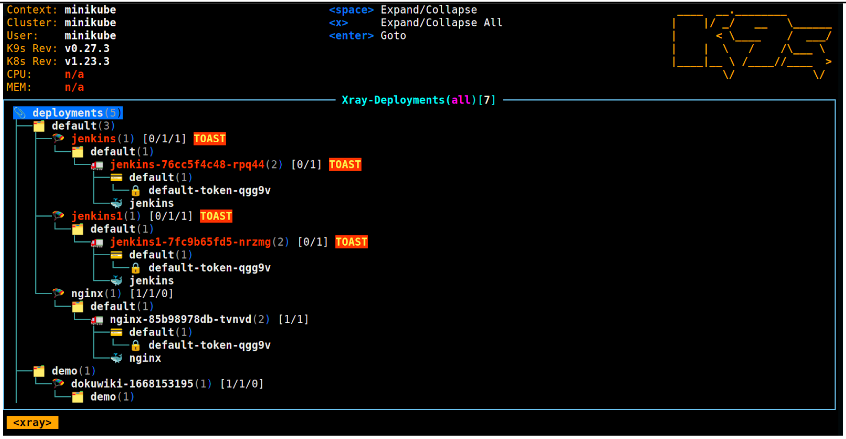
- X-Ray View: X-Ray view is a feature that provides a detailed visualization of the underlying components of a Kubernetes resource. It allows users to see all the individual components that make up a particular resource, such as a pod or a deployment, and view their statuses and relationships with each other.
The X-Ray view is particularly useful when troubleshooting issues with Kubernetes resources, as it provides a detailed and comprehensive view of the resource’s components, making it easier to identify.
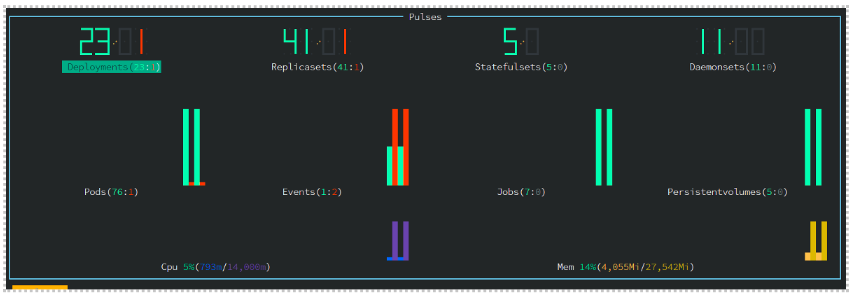
- The pulse view: The Pulse view is a feature that provides a real-time dashboard of the current state of a Kubernetes resource. It displays metrics such as CPU and memory usage, network traffic, and other relevant data in a graphical format, allowing users to monitor the health and performance of their applications.
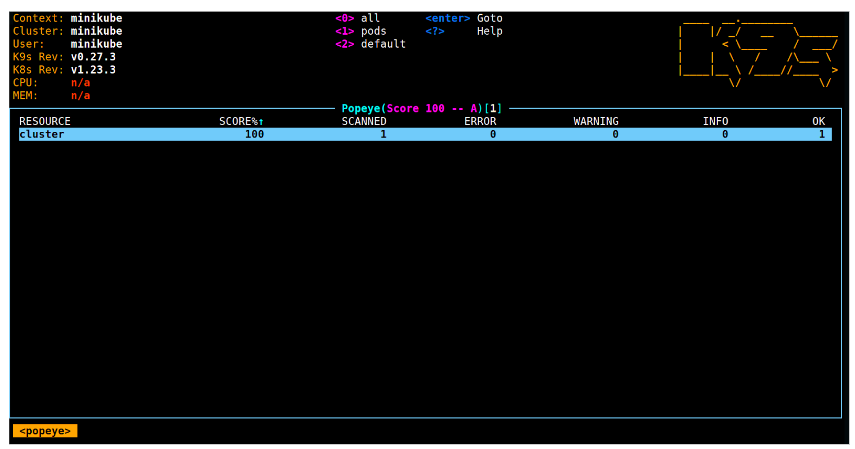
- Popeye View: The Popeye view is a feature that provides a detailed analysis of the configuration and health of Kubernetes resources. It performs a static analysis of Kubernetes resources and provides feedback on any potential issues, misconfigurations, or security vulnerabilities that may exist. The Popeye view is particularly useful for ensuring that Kubernetes resources are properly configured and secure.
Conclusion
In this blog, we learned all about k9s which is a powerful tool for managing Kubernetes clusters from the command line. I hope this blog would help you somewhere. If you liked it, please like share my blog. If you still have any questions kindly contact me at naincy.kumari@nashtechglobal.com.