


Hello Readers!! We are again back with an exciting topic i.e. GOLDILOCKS. In Kubernetes, resource management is crucial for effectively running containerised applications. Kubernetes provides mechanisms to allocate resources such as CPU and memory to individual containers.This is where the concept of “Kubernetes Goldilocks” comes into play. In the context of Kubernetes, the aim is to find the optimal resource allocation for containers – not too little, not too much, but just right.
Introduction
Goldilocks is not an open source tool itself, but rather an open source project focused on providing a resource autoscaler for Kubernetes. This project aims to optimise resource allocation in Kubernetes clusters by dynamically adjusting resource requests and limits for containers based on historical usage patterns.
It’s autoscaler analyses historical metrics, such as CPU and memory usage, and adjusts resource requests and limits accordingly. By right-sizing resources, it can help improve resource utilisation, reduce costs, and prevent performance issues in Kubernetes clusters.
As an open source project, it is available on platforms like GitHub, allowing users to access the source code, contribute to its development, and customise it to their specific needs. It is important to note that it was last updated in September 2021, there may have been updates or changes to it’s project since then.
Features of Goldilocks
- Provides recommendations for resource requests and limits on Kubernetes workloads.
- Dashboard that displays recommended values for Kubernetes resources based on Quality of Service (QoS).
- Assists in optimising Kubernetes resource utilisation.
- CLI utility for analysing Kubernetes deployment resource usage
Components in Goldilocks
Here are the components derived specifically for the Goldilocks autoscaler in Kubernetes:
- Vertical Pod Autoscaler (VPA): The VPA component is responsible for dynamically adjusting the resource requests and limits of individual pods in the Kubernetes cluster. It receives recommendations from its auto scaling controller and applies them to the pod specifications, optimising the allocation of CPU and memory resources.
- Metric Server: The Metric Server is a Kubernetes component that collects and provides resource utilisation metrics for pods and nodes in the cluster. Goldilocks relies on the Metric Server to gather real-time and historical metrics data, which is then used by the auto scaling controller for analysis and decision-making.
- Auto scaling Controller: The Auto scaling Controller is a crucial component of it. It receives metrics from the Metric Server, analyses historical usage patterns, and determines the optimal resource requests and limits for pods. The controller then communicates with the VPA component to adjust the pod specifications accordingly.
- Dashboard: The Dashboard component provides a visual interface for monitoring and managing the Goldilocks autoscaler. It allows users to view real-time and historical metrics, configure auto scaling policies, and monitor the status and performance of pods and the autoscaler itself. The dashboard enhances the observability and control of the auto scaling process.
All these components are specific to it’s autoscaler implementation and may differ in other auto scaling solutions for Kubernetes.
Why we need Goldilocks
- To assist control the resources allotted to containers operating in a Kubernetes cluster, we require Goldilocks in Kubernetes.
- Resource management is a key component of container orchestration because it makes sure that each container has access to the right amount of CPU, memory, and other resources that it needs to function properly.
- In big or complicated deployments, manually defining resource restrictions for each container may be a time-consuming and error-prone
- It helps to guarantee that each container has access to the proper amount of resources to function effectively by dynamically modifying resource restrictions as expected.
- As a conclusion we need this project to fully automate the process of resource and spec management for k8s pods.
Deploying Sample Application & Goldilocks
Now we’ll see how we will create a namespace called javajmx-sample and a Tomcat deployment. We’ll label this namespace in order to win approval. As soon as we label the namespace, a VPA object called Goldilocks-tomcat-example will be created. To perform this we have to follow the certain steps. They are as follows:
STEP-1 Deploying the Metrics Server :
In this step, we’ll be deploying the Metrics server which provides the resource metrics to be used by Vertical Pod Autoscaler. Use the below commands to do so :
helm repo add metrics-server https://kubernetes-sigs.github.io/metrics-server

helm upgrade --install metrics-server metrics-server/metrics-server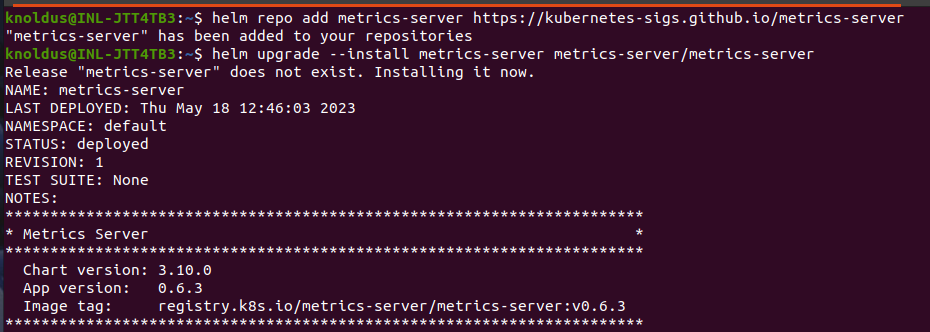
STEP-2 Create namespaces which needs resource recommendation from Goldilocks
In the second step we’ll be deploying sample workloads in the namespace and get the resource recommendation for the applications running on it. Let’s go ahead and create the namespace and label it.
kubectl create ns namespace_name

kubectl label ns namespace_name goldilocks.fairwinds.com/enabled=true
Now to ensure the label was applied successfully, run check this using below command:
kubectl describe ns namespace_name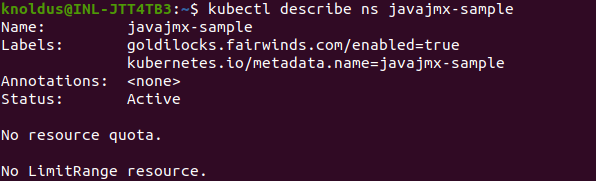
STEP-3 Deploy Goldilocks
We will be using a helm chart to deploy Goldilocks. The deployment creates three objects :
- Goldilocks-controller
- Goldilocks-vpa-recommender
- Goldilocks-dashboard
To deploy it, run the following helm commands:
helm repo add fairwinds-stable https://charts.fairwinds.com/stable

helm upgrade --install goldilocks fairwinds-stable/goldilocks --namespace goldilocks --create-namespace --set vpa.enabled=true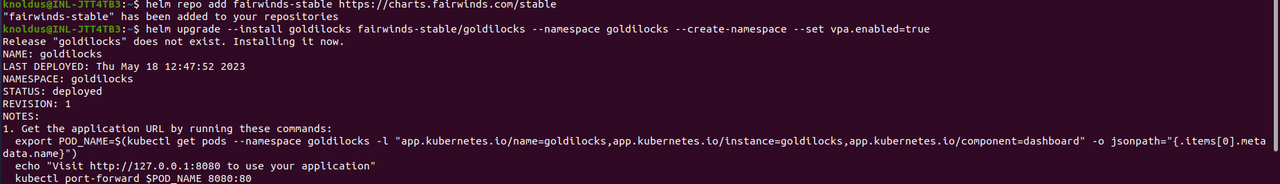
STEP-4 Deploy the sample application
In this step, we will be deploying a sample application in the namespace to get recommendations from it. The application tomcat-example is initially provisioned with a CPU and Memory request of 100m and 180Mi respectively and limits of 300m CPU and 300 Mi Memory.
kubectl apply -f https://raw.githubusercontent.com/aws-observability/aws-o11y-recipes/main/sandbox/javajmx/example/sample-javajmx-app.yaml 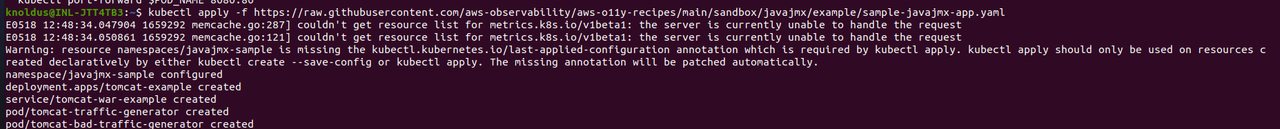
Now, let’s check the application is deployed or not by running the command below :
kubectl get pods -n namespace_name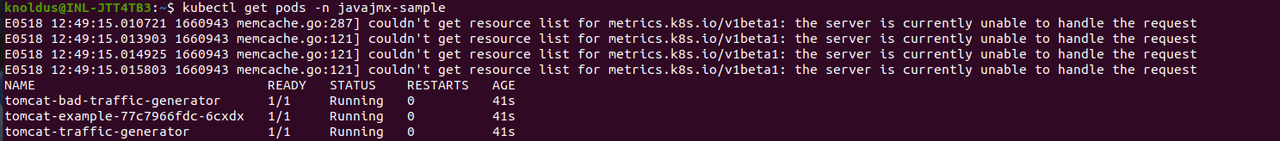
As mentioned earlier, This will be creating VPAs for each deployment in a enabled namespace. Using the kubectl command, we can verify that a VPA was created in the namespace for the goldilocks-tomcat-example:
kubectl get vpa -n namespace_name

STEP-5 Review the recommendation dashboard
Goldilocks-dashboard will expose the dashboard in the port 8080 and we can access it to get the resource recommendation. Now run this kubectl command to access the dashboard:
kubectl -n goldilocks port-forward svc/goldilocks-dashboard 8080:80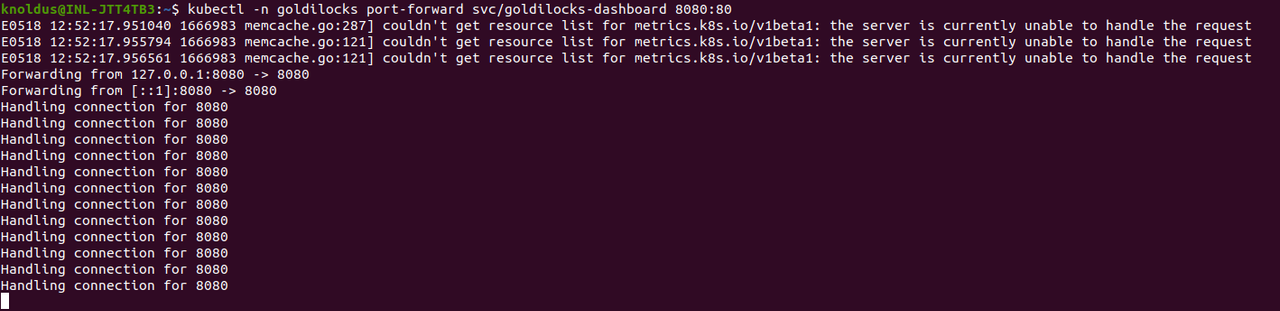
now open a browser to http://localhost:8080 to display the Goldilocks dashboard, and you will see your namespace and sample application is deployed as below
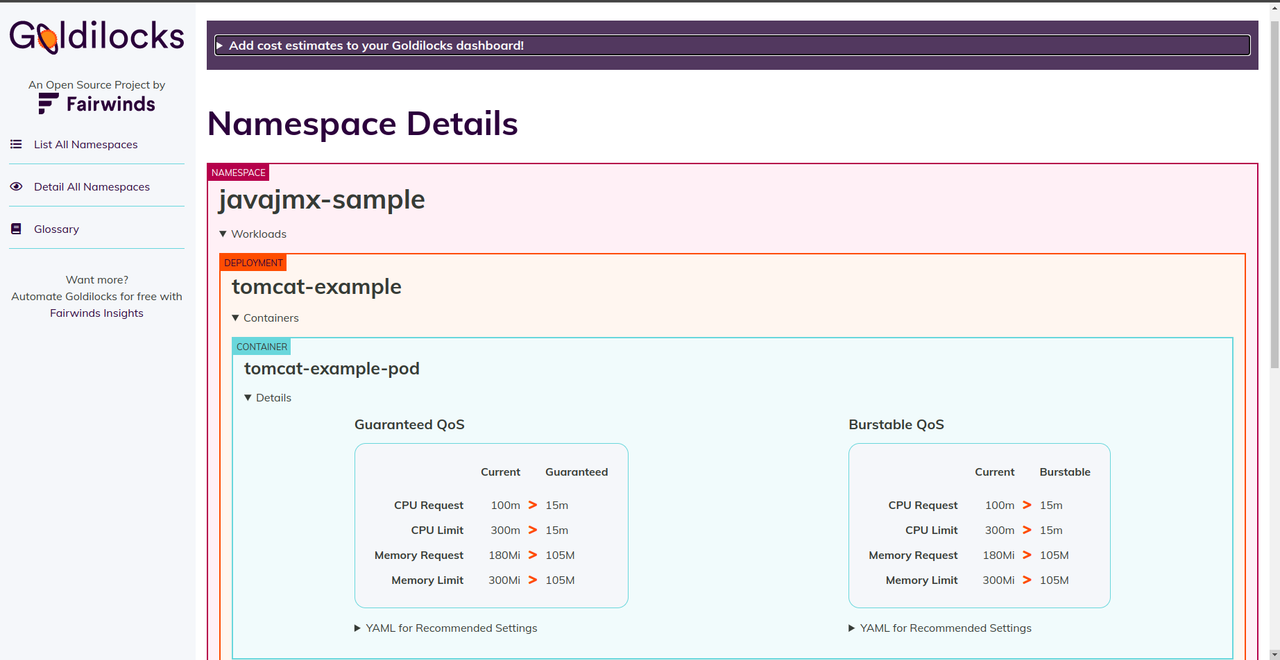
As you can see the requests and limits recommendations for the example javajmx workload. The current column under each Quality of Service (QoS) shows the CPU and memory request and limits set at the time. The Guaranteed and Burstable columns under each QoS show the recommended CPU and memory request limits for the respective QoS.
This is how you can be aware of Goldilocks and to know more use this for your daily hands-on tasks related to Kubernetes.
Conclusion
So in this blog we have learned about a new tool or project which is Goldilocks. Ihope you found it quite interesting and useful whenever you are working with Kubernetes on daily basis. I request you to use this tool, learn something new and make your work easier. Feel free to ask any query regarding this.
Thank You !!!
Keep growing & Keep learning 🙂
Reference
https://www.fairwinds.com/blog/introducing-goldilocks-a-tool-for-recommending-resource-requests
https://www.civo.com/learn/fairwinds-goldilocks-kubernetes-resource-recommendation-tool#conclusion