


In the rapidly evolving world of microservices and containerized applications, effective monitoring and visualization of the service mesh have become essential for maintaining a reliable and efficient infrastructure. Its, an open-source project, has emerged as a powerful tool for providing real-time insights into the behavior and performance of microservices within a service mesh, including popular platforms like Istio. In this beginner’s guide, we will explore how to get started with Its and leverage its capabilities to monitor and visualize your service mesh.
What is Kiali?
Its is an observability platform designed to work seamlessly with service meshes like Istio, providing an intuitive and user-friendly interface to visualize the complex interactions between microservices. It enables you to gain real-time insights into service communication, traffic flow, health status, and distributed tracing.
Prerequisites:
Before diving into setting it up, ensure that you have the following prerequisites in place:
A Kubernetes cluster with Istio already installed and running.
Basic familiarity with Kubernetes and Istio concepts.
Step 1: Installing Kiali
The first step is to install Kiali on your Kubernetes cluster. Fortunately, it provides easy-to-use installation scripts that simplify the process. Follow these steps:
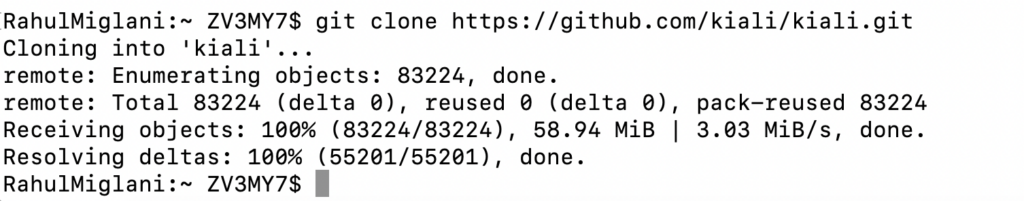
Clone the Kiali GitHub repository:
Run the installation script:
./deploy_kiali.sh
This will deploy Kiali components to your Kubernetes cluster, making it accessible through its web interface.
Step 2: Accessing the Kiali Dashboard
Once its is installed, access the Kiali dashboard by exposing it through a Kubernetes service:
Expose it using the following command
kubectl expose deployment kiali --type=LoadBalancer --name=kiali --namespace=kiali-system
Obtain the external IP address or domain of the Kiali service
kubectl get svc kiali -n kiali-system
Now, you can access the Kiali dashboard using the provided IP address or domain through your web browser.
Step 3: Understanding the Kiali Dashboard
The dashboard is a rich visual interface that presents a wealth of information about your service mesh. Here are some key features and visualizations you’ll encounter:
Graph View: A graphical representation of your service mesh, showing how microservices are connected and interact with each other.
Traffic Flow Visualization: Kiali enables you to see the traffic flow between services, providing valuable insights into communication patterns.
Health Status: Monitor the health status of individual microservices and the overall service mesh, detecting any potential issues.
Tracing: Kiali integrates with distributed tracing platforms, such as Jaeger, to visualize traces and identify performance bottlenecks.
Conclusion:
Lastly, With Kiali up and running, you have now taken the first steps in gaining a deeper understanding of your service mesh and how microservices interact within it. The intuitive interface and powerful visualizations that Kiali provides will be invaluable in maintaining a healthy and efficient microservices architecture.
Finally, As you explore Kiali’s various features and capabilities, you’ll uncover opportunities to optimize your service mesh, enhance performance, and improve the overall resilience of your microservices infrastructure.
Lastly, Remember, this beginner’s guide is just the tip of the iceberg. Continue to delve into Kiali’s documentation and community resources to unlock its full potential as you embark on your journey towards a well-observed, robust microservices environment. Happy monitoring!