


Monitoring and logging are crucial components of maintaining a healthy and reliable infrastructure. With Terraform, you can not only provision and manage your infrastructure as code but also integrate monitoring and logging capabilities seamlessly. In this guide, we will explore how to effectively monitor and log infrastructure resources using Terraform, enabling you to gain valuable insights into the health, performance, and security of your environment.
Choosing the Right Monitoring and Logging Tools
Before diving into the implementation details, it’s important to choose the right monitoring and logging tools for your infrastructure. Consider factors such as scalability, ease of integration, cost, and the specific requirements of your application. Popular choices include Prometheus, Grafana, ELK Stack (Elasticsearch, Logstash, and Kibana), and cloud provider-specific monitoring services like AWS CloudWatch or Azure Monitor. Select the tools that best align with your needs and preferences.
- Instrumenting Infrastructure Resources
To enable effective monitoring and logging, you need to instrument your infrastructure resources. Terraform provides a range of options to achieve this. For example, you can use resource-specific attributes or outputs to expose metrics, logs, or events. Leverage the native capabilities of the infrastructure services you’re provisioning, such as enabling CloudWatch metrics for AWS resources or using Azure Monitor for Azure services. By instrumenting resources during the provisioning process, you lay the foundation for observability.
Defining Monitoring and Logging Configuration
In Terraform, you can define monitoring and logging configurations alongside your infrastructure code. This ensures that monitoring and logging resources are provisioned and configured consistently and reproducibly. Use Terraform modules or custom configuration files to encapsulate the necessary settings for each monitoring and logging tool you’re utilizing. This approach enables you to version and manage your observability configurations alongside your infrastructure code.
- Integrating Prometheus for Monitoring
Prometheus is a popular open-source monitoring system that excels at collecting, storing, and querying time-series data. To integrate Prometheus with Terraform, you can use the Prometheus Terraform provider. Define scrape jobs to collect metrics from your instrumented resources and configure alerting rules for notifications based on specific thresholds. Leverage Prometheus’ flexible query language and visualization tools to gain insights into the performance and health of your infrastructure.
Visualizing Metrics with Grafana
Grafana is a powerful open-source platform for visualizing and analyzing metrics. Integrate Grafana with Terraform using the Grafana Terraform provider. Define dashboards that showcase the important metrics collected by Prometheus or other monitoring tools. Customize the visualization and layout to match your specific requirements. Grafana’s rich set of visualizations and advanced querying capabilities allow you to create insightful and interactive dashboards for monitoring your infrastructure resources.
- Centralized Logging with ELK Stack
The ELK Stack, comprised of Elasticsearch, Logstash, and Kibana, provides a robust solution for centralized logging. Terraform can be used to provision and configure the necessary components of the ELK Stack. Use Logstash to collect, filter, and parse log data from your infrastructure resources. Index the logs in Elasticsearch, which enables fast and efficient search capabilities. Visualize and analyze the logs in Kibana, leveraging its powerful querying and dashboarding capabilities.
Leveraging Cloud Provider Monitoring Services
Cloud providers offer native monitoring services that integrate well with their respective infrastructure resources. For example, AWS provides CloudWatch, which enables monitoring and logging of various AWS services. Azure offers Azure Monitor, which provides monitoring capabilities for Azure resources. Utilize Terraform to provision and configure these cloud provider-specific monitoring services, allowing you to leverage their features and gain insights into the health and performance of your infrastructure.
- Implementing Alerting and Notification Systems
Monitoring without proactive alerting is incomplete. Configure alerting rules in your monitoring tools to notify you when specific conditions or thresholds are met. This ensures that you are promptly alerted about critical events or anomalies in your infrastructure. Most monitoring systems offer flexible alerting mechanisms, including email notifications, Slack integration, or even triggering custom scripts or webhooks. Customize the alerting rules according to your specific requirements and set up escalation paths to ensure that the right team members are notified at the appropriate severity levels.
Incorporating Infrastructure Changes into Monitoring
As your infrastructure evolves, it is crucial to ensure that monitoring and logging configurations are updated accordingly. Whenever you make changes to your infrastructure using Terraform, review and update the monitoring and logging configurations as needed. This includes adding new resources, adjusting metrics and log collection settings, and updating dashboards or visualizations. Regularly review and validate the effectiveness of your monitoring and logging setup to ensure that it accurately reflects your current infrastructure state.
- Continuous Improvement and Optimization
Observability is an ongoing process that requires continuous improvement and optimization. Regularly analyze your monitoring and logging data to identify patterns, trends, and areas for improvement. Optimize the performance of your monitoring tools by tuning resource allocation, retention policies, or data storage options. Explore advanced features and integrations provided by your chosen tools to enhance your observability capabilities. Stay updated with new releases and features of your monitoring and logging tools to leverage the latest advancements in the field.
Security Considerations for Monitoring and Logging
When implementing monitoring and logging in your infrastructure, security should be a top priority. Ensure that your monitoring and logging systems are protected from unauthorized access. Implement secure communication protocols and access controls for data transfer and storage. Encrypt sensitive data in transit and at rest. Regularly audit and review access permissions to monitoring and logging resources. By incorporating security best practices into your observability setup, you can maintain the confidentiality, integrity, and availability of your monitoring and logging data.
Certainly! Here’s an example code snippet that demonstrates how to provision an AWS EC2 instance with Terraform and configure CloudWatch monitoring for it:
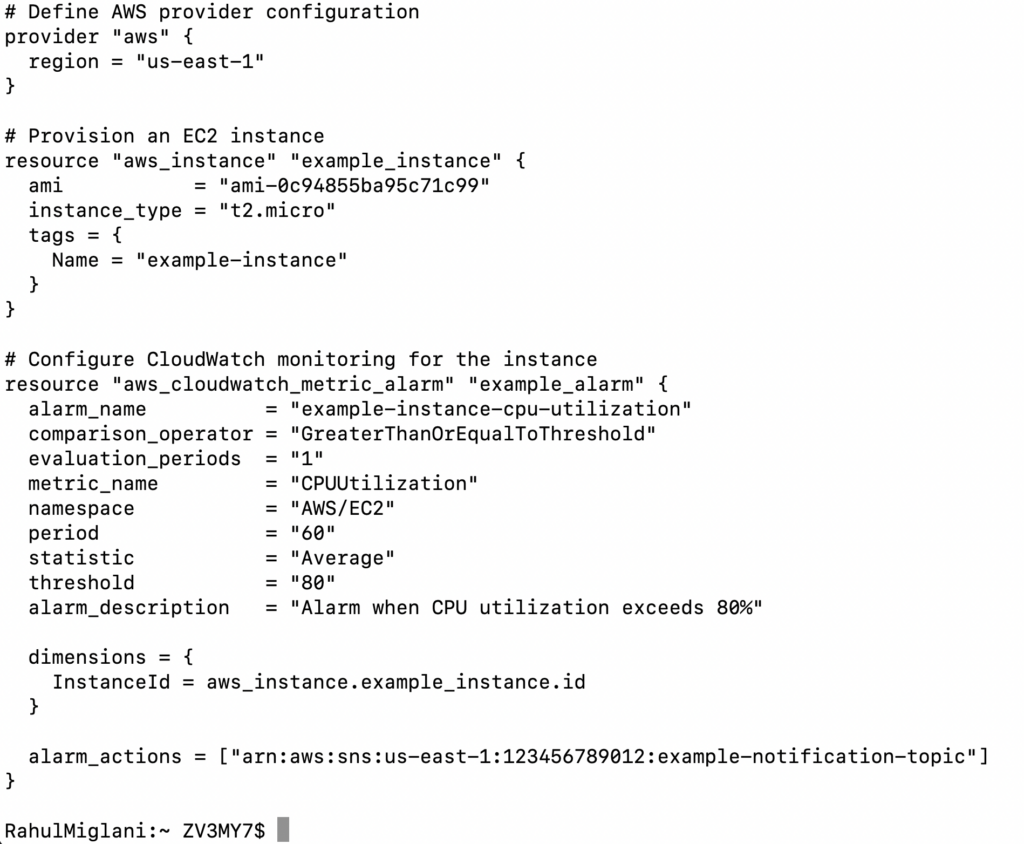
In this example, we first configure the AWS provider and then provision an EC2 instance using the aws_instance resource block. We specify the Amazon Machine Image (AMI) ID, instance type, and add a tag to identify the instance.
Next, we configure CloudWatch monitoring for the instance using the aws_cloudwatch_metric_alarm resource block. We define an alarm that triggers when the CPU utilization exceeds 80%. The alarm is associated with the instance by specifying its ID in the dimensions block. We also set up an action to send a notification to an SNS topic when the alarm is triggered.
This code snippet demonstrates a basic implementation of provisioning an EC2 instance and configuring CloudWatch monitoring for it using Terraform. Remember to replace the placeholder values such as the AMI ID, region, and SNS topic ARN with your own specific values before running the code.
Conclusion
Monitoring and logging infrastructure resources with Terraform is essential for maintaining a reliable and performant environment. By instrumenting resources, defining monitoring and logging configurations, integrating with monitoring and logging tools, and implementing alerting mechanisms, you can gain valuable insights into the health and performance of your infrastructure. Continuously review and optimize your observability setup, incorporate infrastructure changes into monitoring, and prioritize security considerations to ensure a robust and effective monitoring and logging strategy.
With Terraform’s infrastructure as code approach, you can easily version, manage, and reproduce your monitoring and logging configurations alongside your infrastructure code. Embrace observability in your cloud engineering practices, and unlock the power of data-driven insights to optimize your infrastructure’s performance, troubleshoot issues, and proactively respond to evolving requirements.