


Hey Folks, In today’s fast-paced digital world, monitoring the performance of applications and websites is crucial for maintaining an optimal user experience and identifying potential bottlenecks. K6 is a popular open-source load testing tool that allows us to simulate realistic user traffic, while Netdata provides real-time monitoring and visualisation of system metrics. Combining these two powerful tools enables teams to gain deep insights into application performance and make data-driven decisions. In this blog post, we will explore how to leverage K6 and Netdata for monitoring performance test results effectively.
What is K6?
K6 is an open-source load testing tool built with JavaScript. It is designed to be developer-friendly, allowing teams to create realistic load scenarios and test application performance. K6 offers a rich set of features, including scripting, metrics collection, and result analysis, making it an excellent choice for load testing and performance monitoring.
What is Netdata?
Netdata is a real-time monitoring and visualisation tool that provides detailed insights into system and application performance metrics. It offers a comprehensive set of pre-configured plugins for monitoring various aspects of your infrastructure, including CPU usage, memory consumption, disk I/O, network traffic, and much more. Netdata’s intuitive and user-friendly interface allows you to monitor and analyse real-time metrics effortlessly.

Before we dive into the integration process, make sure you have set up K6 and Netdata on our system. Please refer to the official documentation given below for installation steps:
K6 : https://k6.io/docs/getting-started/installation/
Netdata : https://learn.netdata.cloud/docs/getting-started/install-netdata
We can also use this one liner installer for Netdata, where you just need to run the below command for downloading and running the Netdata installation script (recommended):
bash <(curl -Ss https://my-netdata.io/kickstart.sh)Start Netdata:
Once the Netdata installation is complete, open the terminal and run the following command to start the Netdata service:
sudo systemctl start netdata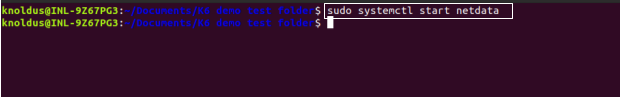
Enable Netdata to start on boot (optional):
Run the following command to enable the Netdata service to start automatically on system boot:
sudo systemctl enable netdataAccess the Netdata web interface:
- Open a web browser.
- Navigate to
http://localhost:19999which is default port to access the Netdata web dashboard for monitoring.
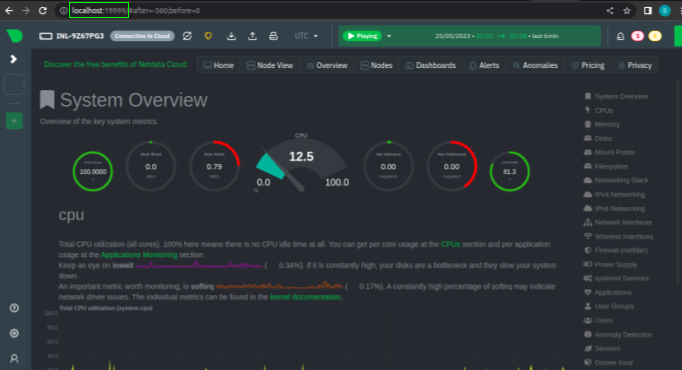
You should now see the Netdata dashboard.
Now that you have Netdata installed and configured, you can proceed with integrating it with K6.
Setting up K6 with Netdata:
1. Write a simple K6 script:
let’s create a basic K6 script that we can use for load testing. Save the following code into a file named myscriptjs:
import http from 'k6/http';
import { sleep } from 'k6';
export const options = {
  vus: 10,
  duration: '10s',
};
export default function () {
  http.get('http://test.k6.io');
  sleep(1);
}
This is the example K6 script that creates 10 VUs in 10 seconds and same will be reflected on our dashboard.
2. Run the load test and send metrics to Netdata:
To run the load test and start sending metrics to Netdata, execute the following command in your terminal or command prompt:
sudo k6 run --out statsd myscript.js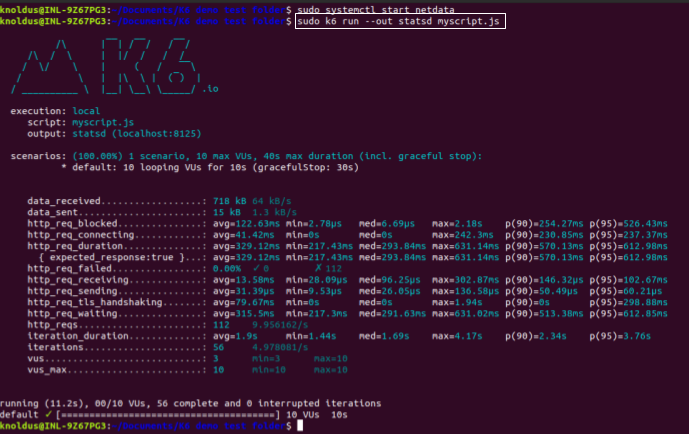
3. Monitor performance with Netdata:
Open your web browser again and navigate to your Netdata instance’s URL (e.g., http://localhost:19999) or refresh the existing browser where the Netdata dashboard opened.
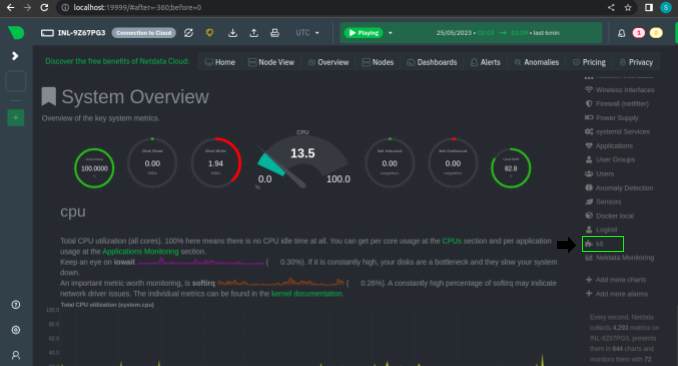
You should now be able to see real-time performance metrics captured during the load test execution in various charts and graphs under the K6 section on the right side of the Netdata dashboard.
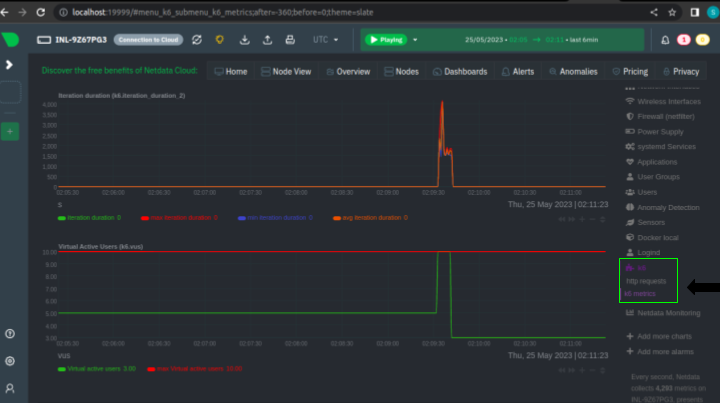
4. Analyse K6 metrics:
Observe the K6 metrics in real-time as the load test progresses. Netdata provides rich visualisation capabilities, including real-time charts, response time, request rate, and error rate in real-time. Gain insights into how the application performs under different loads and identify performance bottlenecks.
5. Stop the Netdata:
Run the following command to stop the Netdata service if you wish
sudo systemctl stop netdataConclusion
By integrating K6 with Netdata, you can enhance your performance monitoring capabilities and gain valuable insights into the performance of your web applications. This end-to-end integration allows you to collect, visualize, and analyze K6 load testing metrics seamlessly within the Netdata monitoring environment. By leveraging the power of these tools together, you can proactively identify performance bottlenecks, optimize resource allocation, and ensure optimal application performance and user experience.