


Overview
Hello Readers !!! I hope you are doing well. I’m back with one new topic of creating Alerts in Apigee. So, today in this blog we’ll see how we can create Latency Alerts in Apigee.Stick with me to the end. I am sure you will found it quite interesting. Let’s get started!!!
Alerts play a very vital role in Apigee for API monitoring. Monitoring API latency is essential for ensuring optimal performance and user experience. This guide provides a detailed step-by-step process for setting up latency alerts in Apigee, enabling timely detection and response to potential performance issues. Here are some reasons why Latency Alerts are essential for API monitoring in Apigee:
- Performance Optimisation: Latency alerts are crucial for identifying and addressing performance in real-time, allowing organisations to optimise API response times and enhance user experience.
- User Satisfaction: Timely detection of latency issues ensures that users experience minimal delays, contributing to higher overall satisfaction and engagement with your APIs.
- Proactive Issue Resolution: Latency alerts enable proactive monitoring, allowing teams to swiftly address potential problems before they escalate, minimising the impact on system performance and reliability.
Steps for Creating Latency Alerts in Apigee
To create Latency Alerts in Apigee follow the below steps:
Configuring Metric Based Alerts:
Step-1 These alerts are triggered by changing in API Metrics.Open the Create alerting policy page in the Google Cloud console.

STEP-2 Select a metric
STEP-3 Deselect Show only active resources & metrics

STEP-4 Select a metric as follows:
- Copy and paste the following in the Select metric field:
| apigee.googleapis.com/Apigee proxy (v2)/policyv2/Percentile of Apigee policy response latencies |
- Select Apigee proxy(v2)
- In the pane that opens to the right, select policyv2
- Then, Percentile of Apigee policy response latencies in the next pane
- Click Apply

STEP-5 Add a filter for the Latency you want to monitor as follows:
- Click Add Filter
- Click in the Filter field and select percentile, env, org from the drop-down menu. for all the percentile 50th 90th 95th and 99th.
- In the Comparator, select =.
- In the Value field, type p99, p50, p95, p99, env_name, org_name as we have setup multi trigger condition.
- Click Done.
- Scroll down and select Transform Data
- Give value for Rolling Window 2 min.
- Rolling window function as mean.


- You can use any filter you have in the filtering list to add filter for monitoring as:


Above image shows you the filter list.
- After clicking on Next, you have to choose the data for Configure Alert Trigger as below:
Configure the alert trigger
To configure the event that triggers the alert, first click Configure trigger in the left-hand pane. Then do the following steps:
As we have used a multi trigger alert condition and we have different values for each percentile you should change the value for each trigger condition. To add multi trigger simple add the multi-condition trigger as shown below:

- Under Condition type, select Threshold.
- In the Alert trigger field, select Any time series violates.
- In the Threshold position field, select Above threshold.
- In the Threshold Value field set value as 1000 ms for 99th percentile, 5000 ms for 95th percentile, 29000 ms for 90th percentile, 45000 ms for 50th percentile in multi-condition trigger.
- And in Advanced Options* set Retest Window to 2 min.
- In the Condition Name field, enterLatency Percentile of Apigee Policy Response (99th) , Latency Percentile of Apigee Policy Response (90th), Latency Percentile of Apigee Policy Response (95th), Latency Percentile of Apigee Policy Response (50th).


With these settings, an alert will be triggered whenever a latency alerts percentile values crosses threshold values.
- Click Next to open the Configure notifications and finalise alert pane.
Set up a notification for the Alert!
- Click in the Notification Channels field. If you have already created a channel for the notification, such as an email address or SMS number, you can select it under Notification Channels.Otherwise, you need to add a channel by selecting Manage Notification Channels. This opens the Notification channels pane, where you can add one or more channels. See Manage notification channels for more information.
- To add notification channel Click on Manage Notification Channels as shown below :
- Again when you click on Next a page will appear like this:

- Once you have selected one or more notification channels, click OK.
- In the Documentation field, you can add a message that will be sent with the notification.
- Click Next to review the details of the alert. If you are satisfied with them, click Create Policy to create the alerting policy.
- As created Multi trigger Alerting Policy Latency alert for all percentile will look like below:


In the above image you can see your alert policy is created but it will only trigger an alert when incident is open .
Configure notifications and finalize alert
Add you notification channel from MANAGE NOTIFICATION CHANNEL as Mobile Devices, Pager Duty, Email, web hook etc as per your choice where you want to get notified for an incident.

- To add Email Click on ADD NEW to add the notification Channel like I have added for Email Notification below:
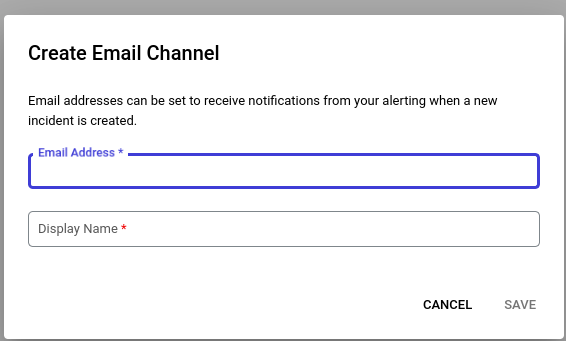
- when you click on ADD NEW a box will open like above and in that you have to give the Email Address and Display Name for your notification channel. Once you will click SAVE notification channel will be added like this:

Below is the image shows you the Notification Channel type and the Channel Display Name.

Now you will be notified with the email notification when the threshold value matches the condition for Latency. This is how Latency Alerts are configured.
Conclusion
Implementing latency alerts in Apigee empowers you to proactively identify and address potential performance bottlenecks in your API proxies. Regular monitoring ensures that you can maintain a high-quality user experience and promptly resolve any issues affecting API response times.
Reference
https://cloud.google.com/apigee/docs/api-monitoring/alerts-examples