


The OpenTelemetry Collector is a fundamental component of the OpenTelemetry ecosystem. It acts as a conduit for telemetry data, enabling the collection, processing, and export of metrics, traces, and logs. This blog delves into the architecture, functionality, and benefits of the OpenTelemetry Collector, explaining why it is considered the core of the OpenTelemetry architecture.
Introduction
The OpenTelemetry Collector is a vendor-agnostic tool designed to facilitate the collection, processing, and export of observability data. It provides a flexible and scalable solution for managing telemetry data across distributed systems.
What is OpenTelemetry?
OpenTelemetry is an open-source observability framework that provides tools to collect, process, and export telemetry data (metrics, logs, and traces) from applications. It aims to standardize observability practices and simplify the integration with various backend systems.
Overview of OpenTelemetry Collector
The OpenTelemetry Collector is a standalone service that aggregates and processes telemetry data from various sources. It supports multiple protocols and formats, making it a versatile tool for observability pipelines. The Collector can run as an agent (co-located with your application) or as a gateway (centralized service).
Key Features of the OpenTelemetry Collector
- Vendor-Agnostic: Works with multiple backends and formats.
- Extensible: Supports custom processing logic through processors and extensions.
- Scalable: Can be deployed in various configurations to handle high volumes of telemetry data.
- Flexible: Offers a modular architecture to customize data pipelines.
Architecture of the OpenTelemetry Collector
The OpenTelemetry Collector’s architecture is modular, consisting of four main components: Receivers, Processors, Exporters, and Extensions.
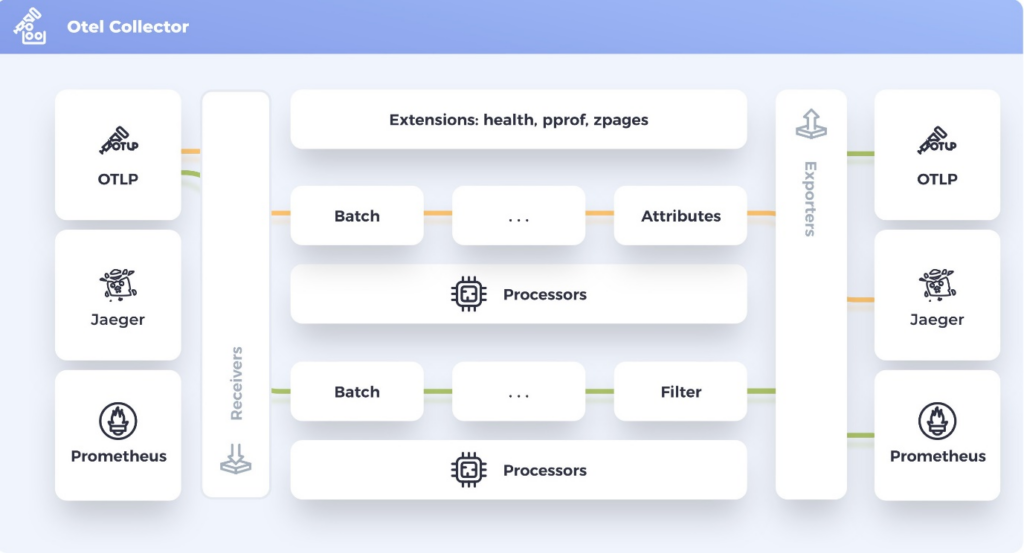
- Receivers Receivers are the entry point for telemetry data into the Collector. They listen for incoming data from various sources and formats (e.g., OTLP, Jaeger, Prometheus).
- Processors Processors perform intermediate operations on telemetry data, such as batching, filtering, sampling, and transforming. They help in optimizing data before exporting it to the desired backend.
- Exporters Exporters send the processed telemetry data to various observability backends like Jaeger, Prometheus, Elasticsearch, and more. They support different protocols and formats to ensure compatibility with various systems.
- Extensions Extensions provide additional capabilities to the Collector, such as health checks, authentication, and advanced configuration management. They enhance the functionality and manageability of the Collector.
Setting Up the OpenTelemetry Collector
The OpenTelemetry Collector can be installed in various ways, including using Docker, Kubernetes, or downloading binaries. Here’s how to install using Docker:
Installation
docker run --rm -p 55680:55680 -p 4317:4317 \ -v $(pwd)/otel-config.yaml:/otel-config.yaml \ otel/opentelemetry-collector:latest \ --config otel-config.yamlConfiguration
The configuration of the OpenTelemetry Collector is done through a YAML file. A basic configuration might look like this:
receivers:
  otlp:
    protocols:
      http:
        endpoint: 0.0.0.0:4319
      grpc:
        endpoint: 0.0.0.0:4320

processors:
  batch:
    timeout: 1s
  resource:
    attributes:
      - key: test.key
        value: "gateway"
        action: insert

exporters:
  prometheus:
    endpoint: "0.0.0.0:8889"
    send_timestamps: true
    namespace: promexample
    const_labels:
      label1: value1

  logging:
    loglevel: info

  jaeger:
    endpoint: jaeger:14250
    insecure: true

extensions:
  health_check:
  pprof:
    endpoint: :1888
  zpages:
    endpoint: :55679

service:
  extensions: [pprof, zpages, health_check]
  pipelines:
    traces:
      receivers: [otlp]
      processors: [batch, resource]
      exporters: [logging, jaeger]
 metrics:
      receivers: [otlp]
      processors: [batch]
      exporters: [logging, prometheus]
Use Cases of the OpenTelemetry Collector
- Centralized Telemetry Collection: The Collector can aggregate data from multiple services and environments, providing a centralized point for telemetry data collection.
- Data Transformation and Enrichment : By using processors, the Collector can transform and enrich telemetry data, making it more useful for analysis and troubleshooting.
- Routing and Exporting Telemetry Data : The Collector can route telemetry data to different backends based on the data type or other criteria, enabling multi-backend support and redundancy.
Benefits of Using the OpenTelemetry Collector
- Unified Data Pipeline: Simplifies observability by providing a single tool for collecting, processing, and exporting telemetry data.
- Scalability: Can handle large volumes of data and scale according to the needs of the application.
- Flexibility: Supports various deployment models (agent, gateway) and configurations.
- Extensibility: Allows for custom processing and integration with multiple backends.
Conclusion
The OpenTelemetry Collector is a powerful and flexible tool that forms the backbone of the OpenTelemetry architecture. By providing a standardized way to collect, process, and export telemetry data, it helps organizations achieve comprehensive observability and improve their ability to monitor and troubleshoot applications.