


In the era of data-driven insights, where informed decision-making is critical, the ability to efficiently work with data in Power BI is pivotal. Tabular Editor, a powerful open-source tool, plays a significant role in streamlining the creation and management of data models, thereby enabling organizations to harness insights effectively.
1. What is Tabular Editor?
Tabular Editor is a tool that lets you easily manipulate and manage measures, calculated columns, display folders, perspectives, and translations in Analysis Services Tabular and Power BI Models.
The tool is available in two different versions:
- Tabular Editor 2.x (free, MIT license) – GitHub project page
- Tabular Editor 3.x (commercial) – Home page
2. Power BI – external tools
The External Tools ribbon is a feature that has been available in Power BI Desktop since the July 2020 release. This feature should be considered essential to anyone who is regularly working in the Power BI space. In order to see the External Tools ribbon on your Power BI Desktop, you will need to have installed at least one External Tool. You can download Tabular Editor from GitHub repository and install it on your machine.
3. Business case
In data analytics world, there is a scenario where your measure’s definitions are the same, but the only difference are base measures. For instance, when performing time-related calculations like Month-to-Date (MTD), Year-to-Date (YTD), and Quarter-to-Date (QTD) for three distinct metrics such as Sales, Cost, and Profit, you need to create 3 measures for MTD, 3 measures for QTD, and 3 measures for YTD, resulting in total 9 measures.
| Sales MTD | Cost MTD | Profit MTD |
| Sales QTD | Cost QTD | Profit QTD |
| Sales YTD | Cost YTD | Profit YTD |
It generates duplicate measures, making it challenging to manage models with frequent time-related calculations.
4. Possible Solutions
Let’s take an example to see how it works:
The tables that I used in this example are Fact Internet Sales and related dimensions such as Dim Date, Dim Product in AdventureworksDW db.
Step 1- create base measures.
- Total Sales = SUM(FactInternetSales[SalesAmount])
- Total Cost = SUM(FactInternetSales[TotalProductCost])
- Total Profit = [Total Sales] – [Total Cost]
Step 2 – create the time-related measures.
- Sales MTD = CALCULATE ([Total Sales], DATESMTD (‘DimDate'[Date]))
- Sales QTD = CALCULATE ([Total Sales], DATESQTD (‘DimDate'[Date]))
- Sales YTD = CALCULATE ([Total Sales], DATESYTD (‘DimDate'[Date]))
- Cost MTD = CALCULATE ([Total Cost], DATESMTD (‘DimDate'[Date]))
- Cost QTD = CALCULATE ([Total Cost], DATESQTD (‘DimDate'[Date]))
- Cost YTD = CALCULATE ([Total Sales], DATESYTD (‘DimDate'[Date]))
- Profit MTD = CALCULATE ([Total Profit], DATESMTD (‘DimDate'[Date]))
- Profit QTD = CALCULATE ([Total Profit], DATESQTD (‘DimDate'[Date]))
- Profit YTD = CALCULATE ([Total Profit], DATESYTD (‘DimDate'[Date]))
and we would end up creating 12 measures in total.
- Base Measures = 3
- Time related measures for each of the 3 base measures = 3 * 3 = 9
- Total = 3 + 9 = 12
To reducing the number of measures in scenarios like this, I will leverage the concept of ‘Calculation Groups’ which can be implemented using an external tool called Tabular Editor. This approach can significantly reduce the number of measures within a report model.
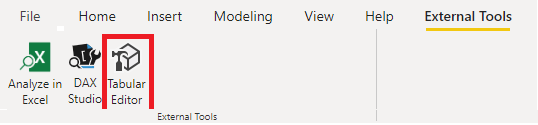
- After setting up the Tabular Editor, click on the External Tool tab in Power BI Desktop (as shown below) and then click on the Tabular Editor icon. This will open the Tabular Editor linked to the DataModel of the existing Power BI file.
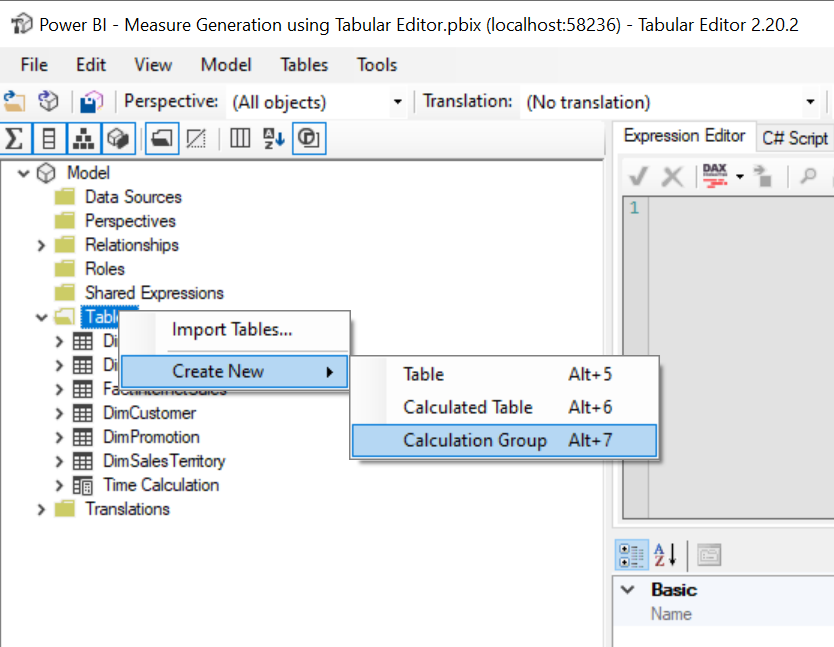
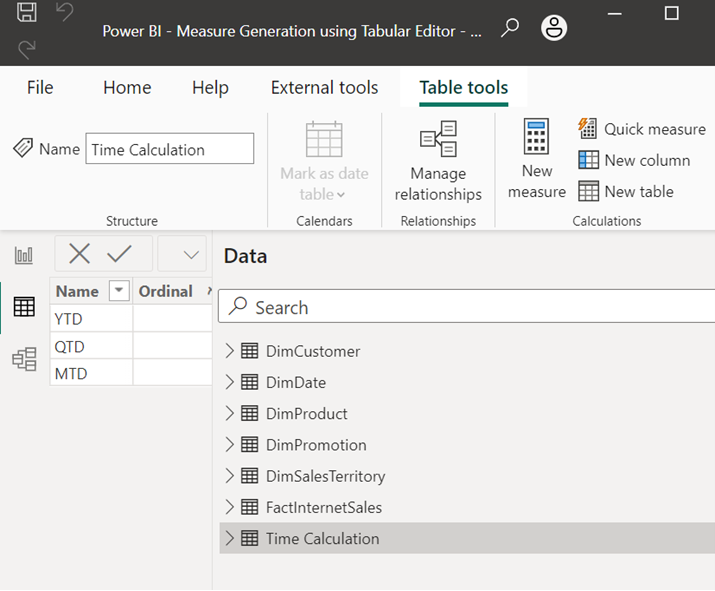
- In Tabular Editor, on the left-hand side panel, right click on the Tables. Select Create New > Calculation Group
- Name your Calculation Group as per your choice. Here, it is named as Time Calculation.
What is a Calculation Group?
A Calculation Group can apply specific calculations on top of existing DAX measures. It is a table that has a single column, by default it is named as Names in Tabular Editor. You can rename the column as you like and it will be displayed on Power BI Desktop. Here I have not renamed the column name.
Now, right-click on the calculated group you just created and click on ‘New Calculation Item’ and add items YTD, QTD, and MTD. Define the measure using DAX
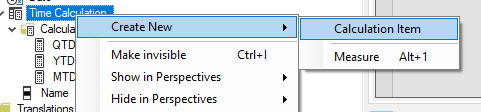
<Calculation Item name>:= CALCULATE (SELECTEDMEASURE(),<Dax Expression>)Note: SELECTEDMEASURE() is used by expressions for calculation items to reference the measure that is currently in context. To know more about SELECTEDMEASURE(), please refer to this link.
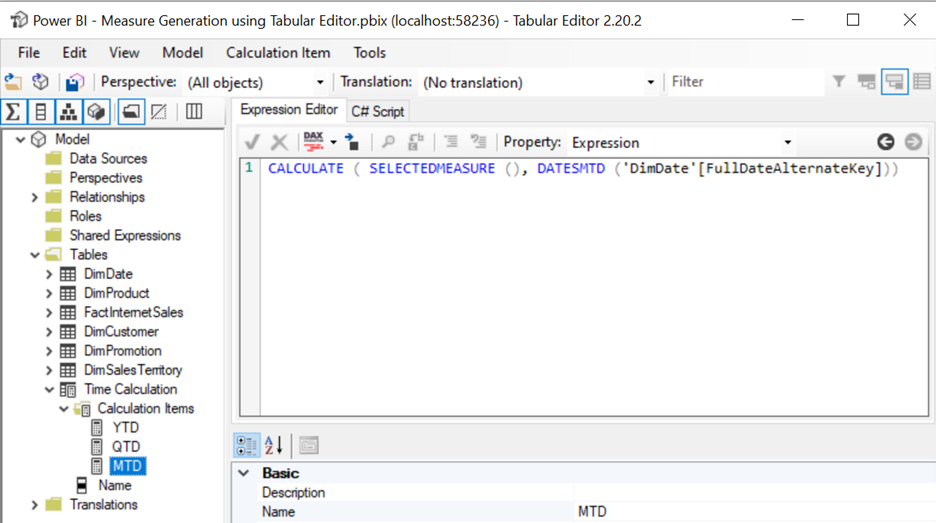
I have defined QTD, YTD, and MTD as below
- YTD: = CALCULATE ( SELECTEDMEASURE (), DATESYTD (‘DimDate'[FullDateAlternateKey]))
- QTD:= CALCULATE ( SELECTEDMEASURE (), DATESQTD (‘DimDate'[FullDateAlternateKey]))
- MTD:= CALCULATE ( SELECTEDMEASURE (), DATESMTD (‘DimDate'[FullDateAlternateKey]))
It will be displayed as shown in the image below:
Press CTRL + S to save your work and the changes done will be applied to the connected database, i.e.Power BI Desktop report file. Close the external tool and go back to the Power BI Desktop. Here you will be able to see a separate table with a column name Names containing values of calculation Items we created.
Now let’s compare the visuals of both solutions, one using the normal method by creating all 9 measures and the other using Calculation groups.
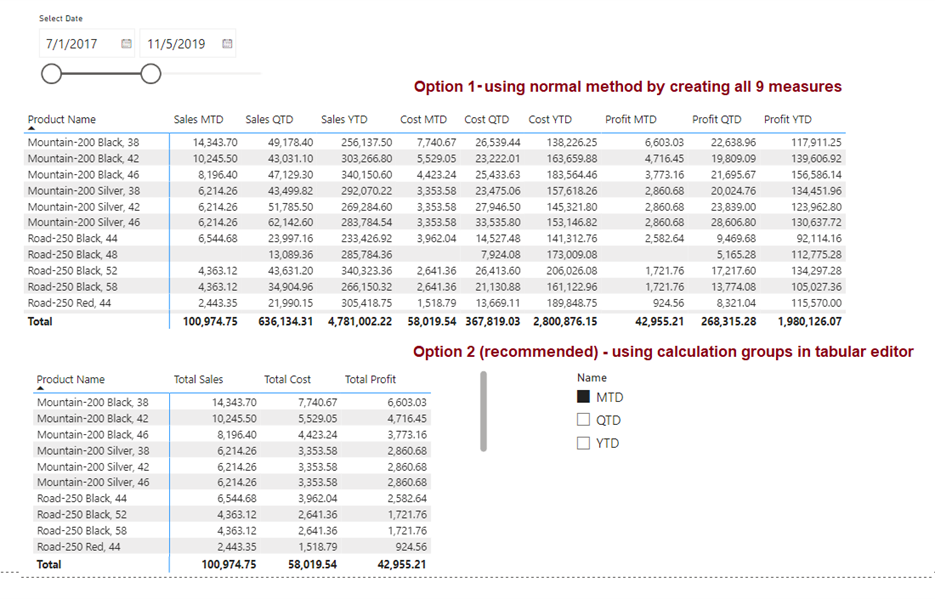
Solution 1 – using normal method by creating all 9 measures. how complex it looks and it’s really difficult to understand the visual having 10 columns in it.
Solution 2: using Calculated Groups with less measures created but achieved the same result.
Below is the screenshot of my demo model that will give you a complete idea.
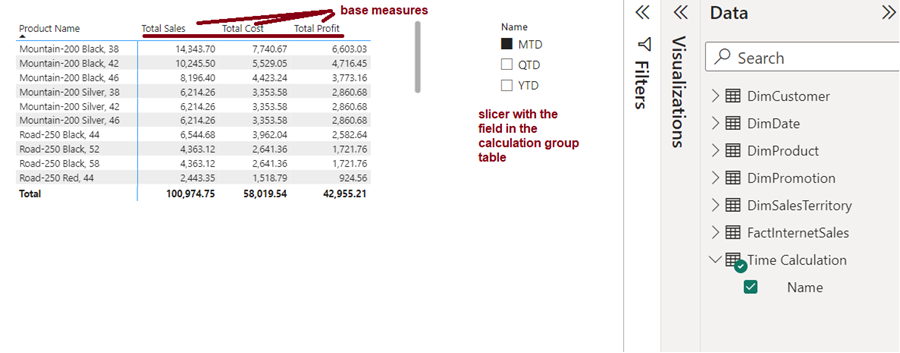
- Add the matrix with all the base measures for which you have created CALCULATION GROUP.
- Also, add a slicer of the field in the Calculation Group table.
When selecting a slicer value, your matrix will reflect the same results with the matrix using DAX in normal way.
4. Wrap-up
By leverage Tabular Editor for measure generation, we can effectively reduce the number of measures in report model. Tabular Editor, when combined with Calculation Groups, proves to be an amazing tool that make your model cleaner and organized.
1 thought on “POWER BI TIPS – Build time-related calculation with ease”
nice post !