Introduction
Monitoring is a crucial aspect of software development that involves tracking the performance and health of applications and infrastructure. it is an open-source monitoring system that is widely used for monitoring cloud-native applications and infrastructure. It provides a flexible and scalable platform for collecting, storing, and querying metrics from various sources. In this blog post, we will discuss the architecture, major components, benefits, and drawbacks of Prometheus, with a focus on Kubernetes monitoring.
Prometheus Architecture
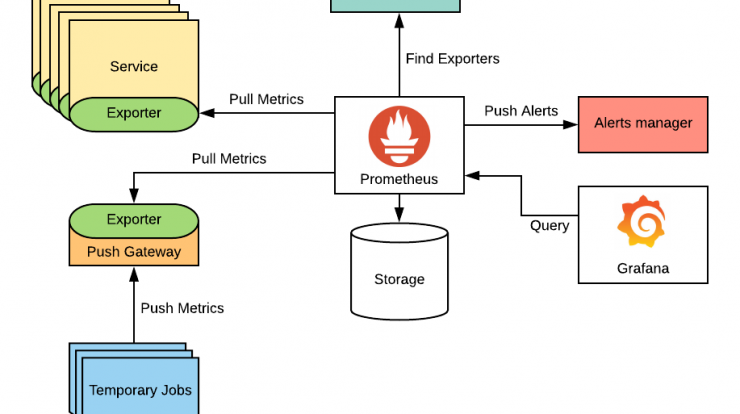
Prometheus has a simple yet powerful architecture that consists of a server, client libraries, exporters, and an alert manager. The server is responsible for collecting and storing metrics, while the client libraries are used to instrument applications and expose metrics to the server. Also exporters are used to collect metrics from third-party systems. After that convert them into a format that it can understand. Relabeling is used to modify the labels attached to metrics before they are stored.
Prometheus uses a flexible data model that allows for the collection of different types of metrics, including counters, gauges, and histograms. The query language used in Prometheus is PromQL, which eventually allows for complex queries and aggregations of metrics. this stores metrics in a time-series database that can be queried using PromQL.
Major Components of Prometheus
The major components of Prometheus include the server, client libraries, exporters, and alert manager. The server is responsible for collecting and storing metrics, while the client libraries are used to instrument applications and expose metrics to the server. Exporters are used to collect metrics from third-party systems and convert them into a format that it can understand. The alert manager is used to define and manage alerts based on the collected metrics.
Grafana is a popular visualization tool that can be used to create dashboards and visualizations based on the metrics collected by the same. It provides a user-friendly interface for exploring and analyzing metrics.
Benefits and Drawbacks of Prometheus
Prometheus provides several benefits for monitoring applications and infrastructure. It is easy to set up and use, and provides a flexible and scalable platform for collecting and querying metrics. It also has a large and active community that provides support and contributes to its development.
However, this also has some potential drawbacks. It can be resource-intensive, especially when collecting and storing large amounts of data. It also has some limitations in terms of scalability, which can be a challenge when monitoring large and complex systems.
Metrics in Prometheus
Prometheus collects metrics using a flexible data model that allows for the collection of different types of metrics, including counters, gauges, and histograms. Counters are used to track the number of events that occur over time, while gauges are used to track the value of a metric at a specific point in time. Histograms are used to track the distribution of values over time.
To instrument code with its client libraries, developers need to add code to their applications that exposes metrics to the Prometheus server. This can be done using various client libraries available as well as for different programming languages.
Prometheus and Development Environment
Prometheus can be used in a development environment to monitor applications and infrastructure. It can be integrated with Kubernetes, which is a popular container orchestration platform used for deploying and managing cloud-native applications. Prometheus can be used to monitor Kubernetes clusters, providing insights into the performance and health of the cluster.
Kubernetes Monitoring with Prometheus
Prometheus is well-suited for monitoring Kubernetes clusters. It can be used to collect and store metrics from various sources within the cluster. Including the Kubernetes API server, kubelet, and cAdvisor. It can be integrated with Kubernetes using the own Operator, which provides a declarative way of defining and managing Prometheus instances and related resources.
Conclusion
above all, Prometheus is a powerful and flexible monitoring system that is well-suited for monitoring cloud-native applications and infrastructure. It provides a simple yet powerful architecture that allows for the collection, storage, and querying of metrics. While it has some potential drawbacks, its benefits outweigh the challenges, making it a popular choice for monitoring cloud-native environments. As a result, by using Prometheus, developers can gain insights into the performance. And health of their applications and infrastructure, enabling them to identify and resolve issues quickly.
For more, you can refer to the Prometheus documentation.
For a more technical blog, you can refer to the Nashtech blog: https://blog.nashtechglobal.com/


