


Insurance underwriting has traditionally been a point-in-time activity. An underwriter reviews an applicant’s history, evaluates available data, assigns a risk score, and determines pricing and coverage. While this approach has worked for decades, modern insurers increasingly operate in environments where risk conditions change continuously.
A commercial vehicle may begin operating in a high-risk weather zone. A fleet driver may suddenly exhibit aggressive driving patterns. An industrial asset may report sensor readings that indicate elevated failure risk. By the time these changes appear in a periodic underwriting review, the insurer may already be exposed to an additional risk.
In previous articles,
- Data-Driven Risk Segmentation in Underwriting with Delta Lake
- Using Delta Lake Time Travel to Reconstruct Historical Underwriting Decisions
- Creating a Single Risk Profile for Underwriters with Delta Lake
We explored how Delta Lake can help modernize underwriting data platforms, create unified risk profiles, segment policyholders, and reconstruct historical underwriting decisions. The next logical step is enabling underwriting systems to react to changing risk conditions in near real-time.
In this article, we’ll explore how Delta Live Tables and Structured Streaming can ingest live insurance data streams and continuously calculate risk scores that underwriters can monitor as events occur.
Why Real-Time Underwriting Matters?
Most underwriting systems are designed around batch-oriented processes:
- Daily policy updates
- Weekly risk reports
- Monthly portfolio reviews
However, many modern insurance data sources generate events continuously:
- Vehicle telematics devices
- Fleet management platforms
- Industrial IoT sensors
- Smart property monitoring systems
- Weather and catastrophe feeds
Instead of waiting for scheduled processing windows, insurers can evaluate these signals as they arrive and identify elevated risk within minutes. For instance:
- Detecting unsafe driving behavior across commercial fleets
- Identifying properties exposed to severe weather events
- Monitoring equipment health for industrial insurance
This enables a shift from retrospective underwriting to proactive risk management.
Reference Architecture
A typical real-time underwriting platform may follow the architecture shown below:
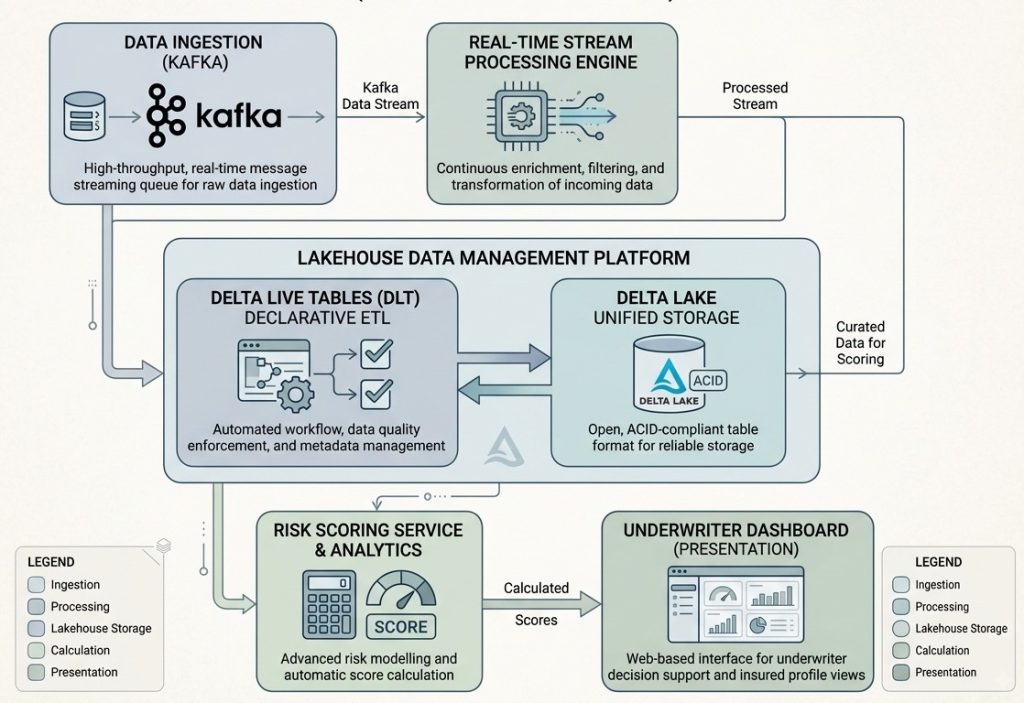
Risk events can originate from multiple systems:
| Source | Example Signals |
| IoT Sensors | Temperature, vibration, pressure |
| Fleet Management Systems | Speeding, harsh braking, route deviations |
| Weather Feeds | Storm alerts, flooding risk, wildfire indicators |
| Operational Systems | Claims events, inspections, maintenance records |
Kafka provides a scalable ingestion layer capable of processing millions of events per day, while Delta Live Tables (Delta Lake) simplifies pipeline development, monitoring, and data quality enforcement.
From Batch Analytics to Streaming Risk Intelligence
In the previous telematics example, risk profiles were generated from an existing Delta table containing driving events.
The same logic can be applied continuously as events arrive. Instead of loading CSV files periodically, the underwriting platform consumes streaming messages from Kafka and computes risk indicators in real time. For instance,
{
    "event_id": "evt-12345",
    "driver_id": "DRV009",
    "vehicle_id": "VEH009",
    "event_type": "speeding",
    "speed": 118.5,
    "timestamp": "2026-01-15T10:15:00Z"
}
Each event becomes part of an evolving risk profile.
Building the Streaming Pipeline with Delta Live Tables
Bronze Layer: Raw Telemetry
The Bronze layer captures incoming events without significant transformation.
import dlt
from pyspark.sql.functions import *

@dlt.table(comment="Raw telematics events from Kafka")
def bronze_telematics():
    return (
      spark.readStream
        .format("kafka")
        .option("kafka.bootstrap.servers", "broker1:9092")
        .option("subscribe", "telematics-events")
        .load()
        .selectExpr("CAST(value AS STRING) as payload")
)| event_id | driver_id | vehicle_id | event_type | speed | event_timestamp |
|---|---|---|---|---|---|
| evt-100000 | DRV170 | VEH050 | geofence_exit | 113.1 | 2026-02-17T22:58:49.000Z |
| evt-100007 | DRV002 | VEH050 | geofence_exit | 40.6 | 2026-02-25T22:57:21.000Z |
| evt-100023 | DRV088 | VEH096 | geofence_exit | 103.9 | 2026-02-14T06:10:26.000Z |
| evt-100036 | DRV052 | VEH036 | geofence_exit | 69.4 | 2026-03-28T12:11:34.000Z |
| evt-100043 | DRV188 | VEH005 | geofence_exit | 132.2 | 2026-01-28T17:02:47.000Z |
Silver Layer: Enriched Driving Events
The Silver layer applies business rules and quality checks.
from pyspark.sql.functions import from_json
from pyspark.sql.types import *

schema = StructType([
    StructField("event_id", StringType()),
    StructField("driver_id", StringType()),
    StructField("vehicle_id", StringType()),
    StructField("event_type", StringType()),
    StructField("speed", DoubleType()),
    StructField("timestamp", TimestampType())
])

@dlt.table(comment="Validated telematics events")
def silver_driving_events():

    return (
     dlt.read("bronze_telematics")
        .select(from_json("payload", schema).alias("json"))
        .select("json.*")
        .withColumn("is_speeding", when(col("speed") > 100, 1).otherwise(0))
)| event_id | driver_id | vehicle_id | event_type | speed | event_timestamp | is_speeding |
|---|---|---|---|---|---|---|
| evt-100000 | DRV170 | VEH050 | geofence_exit | 113.1 | 2026-02-17T22:58:49.000Z | 1 |
| evt-100007 | DRV002 | VEH050 | geofence_exit | 40.6 | 2026-02-25T22:57:21.000Z | 0 |
| evt-100023 | DRV088 | VEH096 | geofence_exit | 103.9 | 2026-02-14T06:10:26.000Z | 1 |
| evt-100036 | DRV052 | VEH036 | geofence_exit | 69.4 | 2026-03-28T12:11:34.000Z | 0 |
| evt-100043 | DRV188 | VEH005 | geofence_exit | 132.2 | 2026-01-28T17:02:47.000Z | 1 |
Gold Layer: Generating Near Real-Time Driver Risk Scores
With streaming analytics, calculating driver scores using aggregated driving behavior metrics such as speeding events and average speed can become continuously updated underwriting indicators.
Driver Risk Profile
@dlt.table(comment="Driver risk profile")
def driver_risk_profile():

    return (
     dlt.read("silver_driving_events")
        .groupBy("driver_id")
        .agg(
            count("*").alias("total_events"),
            sum("is_speeding").alias("speeding_events"),
            avg("speed").alias("avg_speed")
        )
)| Driver ID | Total Events | Speeding Events | Average Speed |
|---|---|---|---|
| DRV070 | 3 | 0 | 68.03 |
| DRV146 | 7 | 4 | 107.83 |
| DRV014 | 5 | 2 | 92.14 |
| DRV192 | 7 | 1 | 72.16 |
| DRV069 | 4 | 2 | 91.80 |
Driver Risk Score
@dlt.table(comment="Real-time driver score")
def driver_score():

    profile = dlt.read("driver_risk_profile")

    return (
        profile.withColumn(
            "risk_score",
            100
            - (col("speeding_events") * 2)
            - (col("avg_speed") * 0.5)
        )
)| Driver ID | Total Events | Speeding Events | Average Speed | Risk Score |
|---|---|---|---|---|
| DRV070 | 3 | 0 | 68.03 | 65.98 |
| DRV146 | 7 | 4 | 107.83 | 38.09 |
| DRV014 | 5 | 2 | 92.14 | 49.93 |
| DRV192 | 7 | 1 | 72.16 | 61.92 |
| DRV069 | 4 | 2 | 91.80 | 50.10 |
Event-Driven Underwriting
Real-time analytics becomes even more valuable when paired with event-driven actions. For instance:
High-Risk Driver Alert
high_risk = (
    driver_scores.filter(col("risk_score") < 32)
)| Driver ID | Total Events | Speeding Events | Average Speed | Risk Score |
|---|---|---|---|---|
| DRV107 | 4 | 3 | 124.30 | 31.85 |
| DRV178 | 3 | 3 | 126.50 | 30.75 |
| DRV048 | 6 | 5 | 117.25 | 31.38 |
High Speed Alert
high_speed_risk = (
    driving_events.filter(col("speed") > 139.7)
)| Event ID | Driver ID | Vehicle ID | Event Type | Speed | Event Timestamp | Is Speeding |
|---|---|---|---|---|---|---|
| evt-100189 | DRV079 | VEH095 | idle | 140.0 | 2026-01-12T18:22:57.000Z | 1 |
| evt-100604 | DRV077 | VEH074 | idle | 139.8 | 2026-03-26T23:28:05.000Z | 1 |
| evt-100628 | DRV195 | VEH084 | harsh_acceleration | 139.8 | 2026-01-13T02:12:53.000Z | 1 |
These events can trigger:
- Underwriter notifications
- Risk review workflows
- Premium recalculations
- Portfolio monitoring dashboards
- Automated investigations
Instead of waiting for monthly reports, underwriting teams receive actionable risk signals immediately.
Benefits of Delta Live Tables for Underwriting
Delta Live Tables (Delta Lake) provides several advantages for insurance analytics teams:
- Simplified Streaming Development – Engineers define transformations declaratively while DLT manages orchestration and dependencies.
- Operational Visibility – Pipeline lineage, monitoring, and observability are built into the platform.
- Unified Batch and Streaming Architecture – The same Delta Lake foundation supports historical underwriting analysis, real-time risk segmentation/scoring, and compliance reporting
This reduces architectural complexity while improving analytical capabilities.
In-Summary
As insurers increasingly adopt telematics, IoT devices, fleet management platforms, and external risk feeds, underwriting is evolving from a periodic activity into a continuous process.
By combining Kafka, Delta Live Tables, Structured Streaming, and Delta Lake, organizations can build underwriting platforms that assess risk as events occur rather than after the fact. Risk scores become living indicators that continuously adapt to changing conditions, enabling underwriters to respond faster and make more informed decisions.
In our previous articles, we focused on historical analysis, risk profiling, segmentation, and auditability. Real-time underwriting analytics builds on that same Delta Lake foundation and represents the next step toward intelligent, event-driven insurance operations. For insurers pursuing usage-based insurance (UBI), commercial fleet monitoring, or IoT-enabled risk management, real-time underwriting is no longer a future capability. It is rapidly becoming a competitive necessity.