


The Agile methodology is now commonly used in software development projects. Our goal is to implement a continuous release approach for our product, enabling us to gather client feedback at the earliest possible stage. To achieve this, release cycles have been shortened to 1 week, 2 weeks, or 1 month. To ensure the quality of these frequently releases, applying automation testing to our project is necessary. Analyzing test results is a part of the automation testing process and using a good reporting tool will save a lot of effort.
1. Challenge in analyzing automation test results
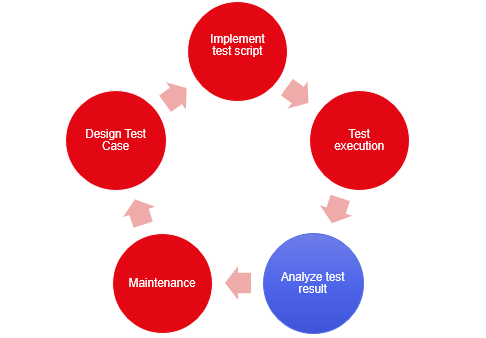
After running the test script, we need to check the result and analyze and identify the root cause of the failure cases such as product bugs, environment issues, or unstable automation scripts. It doesn’t take too much time if there are around one hundred test cases. What if, we have thousands of test scripts and require their execution on diverse platforms and browsers for each release within a CI/CD pipeline? It will take a huge effort to detect the root cause of the failure cases and track them in bug tracking system.
In order to minimize the effort involved in analyzing testing results, The following approaches can be applied:
- Disable the failed cases from the test suite: For this approach, we need to add the test scripts into the test suite again after the issues are fixed.
- Associate automation test scripts with the Test management system and link them to relevant bug records in the bug tracking system: Thanks to this, if the test cases are failed by the existing bug, we can detect it quickly.
- Alert for new issues: we implement the alert mechanism to send a notification if there are new failures. Instead of reviewing the test result every release, we only need to look at them whenever new issues happen.
- Auto-analyze test result by a suitable tool: I focus on the ReportPortal on this post.
2. ReportPortal Overview
When building an automation framework with the open-source tool, we can choose familiar reports like Extent report, Allure report or Mocha Awesome report, etc. For the enterprise tools, they may build their report. However, most of them are only able to show the number of passed/failed test cases, the log and screenshot are attached. They are not able to tell us what the root cause of the failure is.
ReportPortal is an open-source tool leveraging AI and machine learning to offer efficient test result analysis. Here are some impressive features of the ReportPortal.
2.1 Effortless integration with multiple automation frameworks
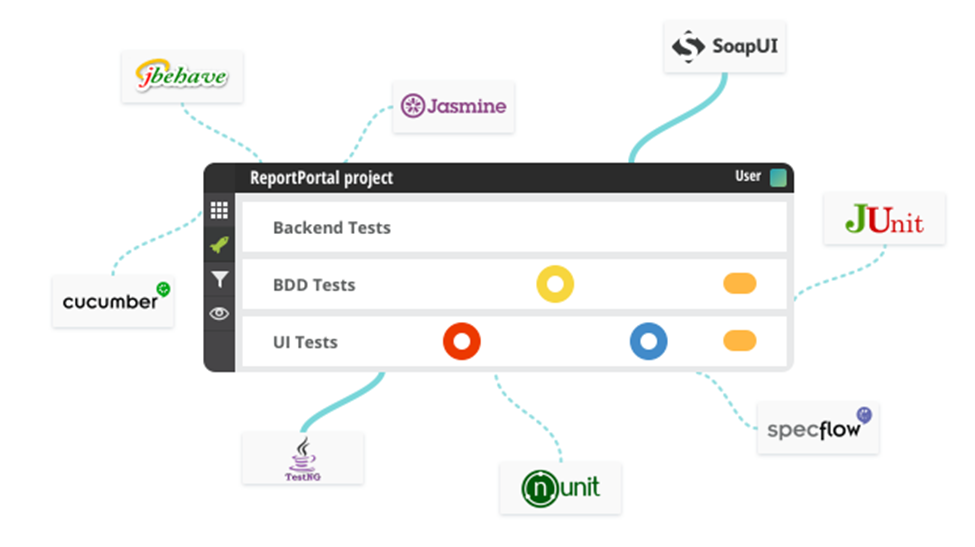
ReportPortal is able to integrate with most of popular automation frameworks in various kinds of languages including Java, C#, Javascript, and Python. You can find all the supported frameworks here.
You’re also easy to find the sample for integrating ReportPortal into many kinds of frameworks on ReportPortal Github. In this post, I focus on the detailed step to integrate ReportPortal into TestNG framework.
2.2 Aggregate all info about test in one place
ReportPortal not only includes attached logs and screenshots but also provides an execution history of test scripts. This valuable feature enables us to assess both the product’s stability and the effectiveness of the automation test scripts.
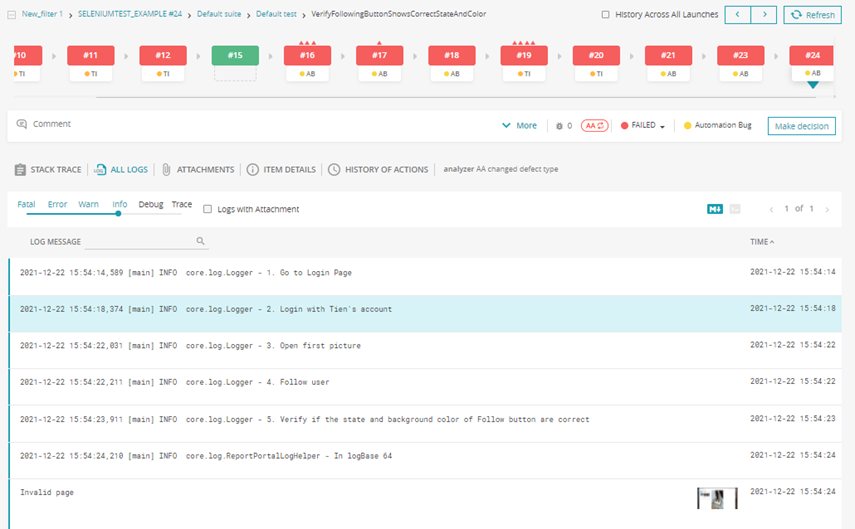
2.3 Classify test failures and quickly observe statistics of the test run
This tool offers the ability to compare current failures with past occurrences, simplifying the identification of root causes.
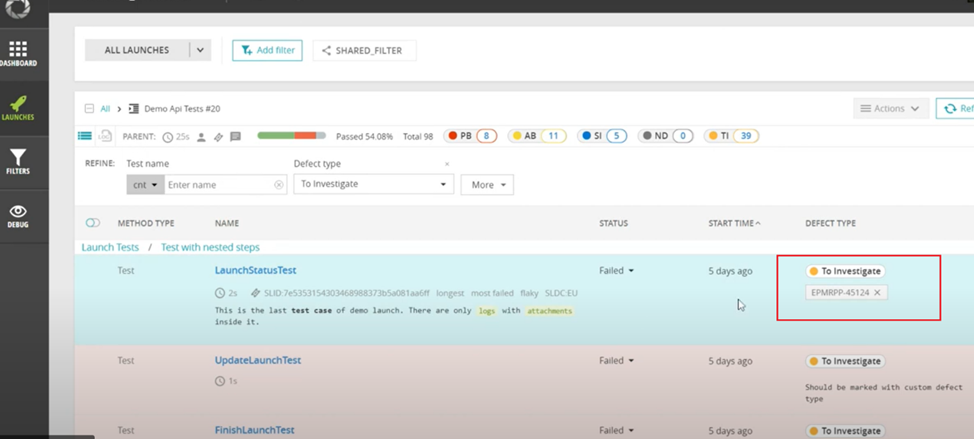
The classification of test failures on the user interface allows for convenient assessment of the overall test run status. Furthermore, the flexibility provided by the ReportPortal settings empowers us to define distinct failure types.
2.4 Delegate a part of analytics works to Artificial Intelligence
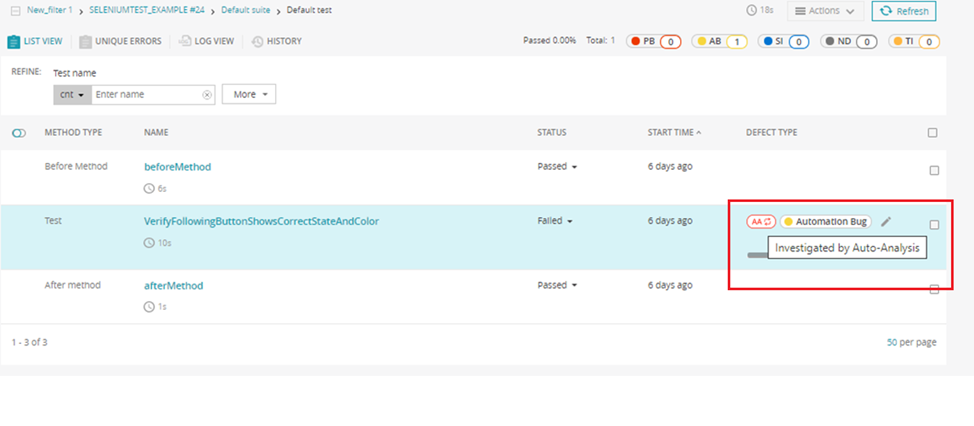
We see how the tool is leveraging AI and machine learning here. AI and machine learning analyze test failure automatically. Based on the history of the test cases, it makes the decision about the root cause of the test failure as Product Bug or Automation Bug or System issue, etc. The automatically analyzing result will be marked AA (as screenshot above).
2.5 Integrate with Bug tracking systems
If we’re using Jira as a Bug tracking system, ReportPortal supports a very useful plugin to create Jira issues automatically. The created Jira issue will be linked to the test result on ReportPortal. Besides, when you have the same failure as the old failure, ReportPortal will also link the new failure with the old Jira issue automatically.
3. Analyze test result automatically with ReportPortal
This section provides insights into the automated test result analysis capabilities of ReportPortal. We will explore how ReportPortal can automatically analyze test results, offering a deeper understanding of its automated analysis functionalities.
3.1 Auto-Analysis component
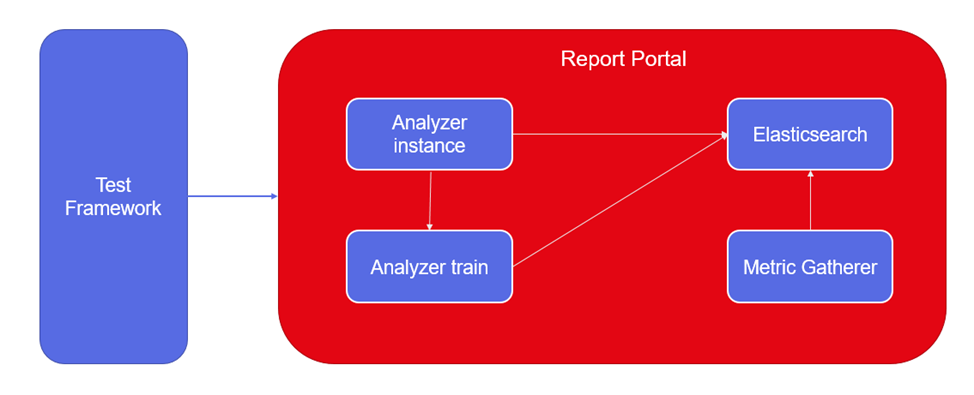
After the automation test framework send the information to the ReportPortal, the data will be processed through 4 main components.
- Elasticsearch is responsible for storing the base analysis, the data for training model and metrics for metrics gatherer.
- Analyzer instance will receive the data from the test framework and perform all operations like indexing/removing/searching logs, auto-analysis, and machine learning suggestions.
- Analyzer train instance is responsible for training models for Auto-analysis and machine learning suggestions functionality.
- Metrics gatherer calculates metrics about the analyzer usage and requests deletion of custom models if metrics go down.
3.2 Auto-Analysis process
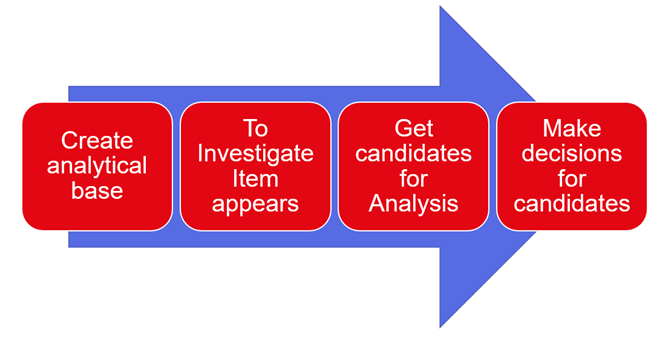
The Auto-Analysis includes 4 steps:
- Create analytical base: Firstly, we need to start analyzing test results manually. After that, the following information will be sent to Elasticsearch
- An Item ID
- Logs
- Issue Type
- Flag: “Analyzed by”
- A launch name
- Launch ID
- Unique ID
- Test case ID
- “To investigate” item appears: when a new failure appears, ReportPortal will start getting candidates for analysis
- Get candidates for analysis: Elasticsearch will search for similar logs in the analytical base based on the information like the launch name, test case ID, log, etc and return service Analyzer 10 logs with the highest score for each log.
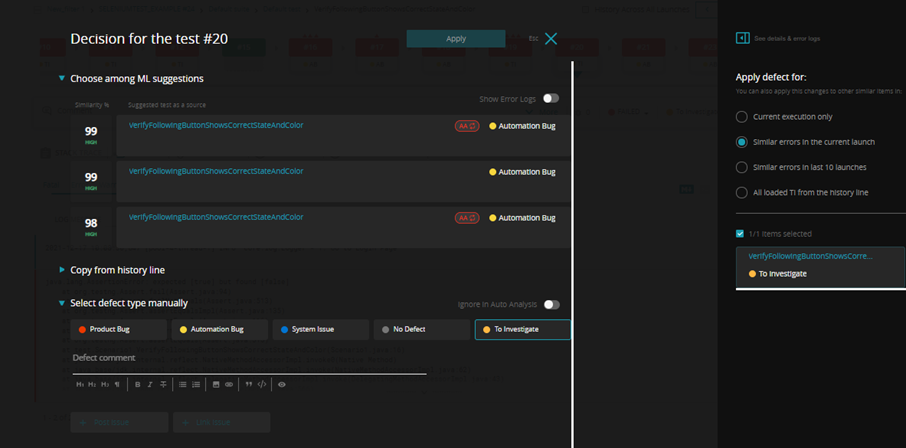
- Make decision for candidates: All candidates will be processed by a machine learning model named XGBoost. The model will return the probability of each defect type based on 30 defined criteria and choose the defect type which has the highest probability.
3.3 How model are retrained?
Every time the suggested test defect type is changed to another one, this will be saved to a filesystem. When the number of changes reaches the threshold, retraining will be triggered. ReportPortal will create a new customized model. If it gives better results than the old model, it will be saved and used in the further auto-analysis and suggestions functionality.
4. Integrate ReportPortal with TestNG Framework
Let’s assume that we already have a TestNG Framework which uses Log4J for logging.
4.1 Set up ReportPortal
Please refer to this link to install ReportPortal on your Linux/Mac machine and make sure the following steps have been done:
- Install Docker
- Install Docker Compose
- Download the latest ReportPortal Docker compose file
- Make the ElasticSearch configuration prerequisites for the analyzer service
- Start the application using the following command: “docker-compose -p reportportal up -d –force-recreate”
4.2 Create project with ReportPortal
After installing ReportPortal, it can be open in the browser with localhost:8080. The port will depend on what we configure in the Docker compose file. The ReportPortal has 2 default accounts:
- Default User: default\1q2w3e
- Administrator: superadmin\erebus
The Administrate menu at the bottom left is to go to the project management page. We create a new project from here:
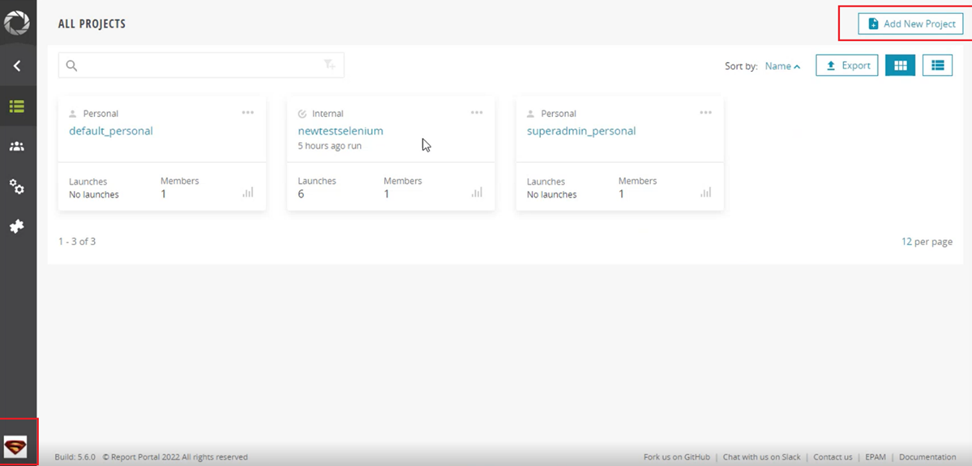
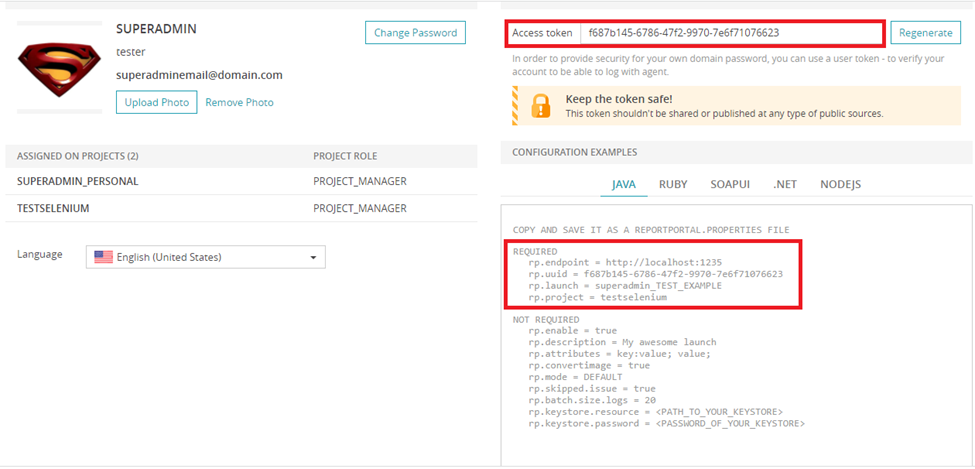
We need to take note some information to integrate with our framework as screenshot below.
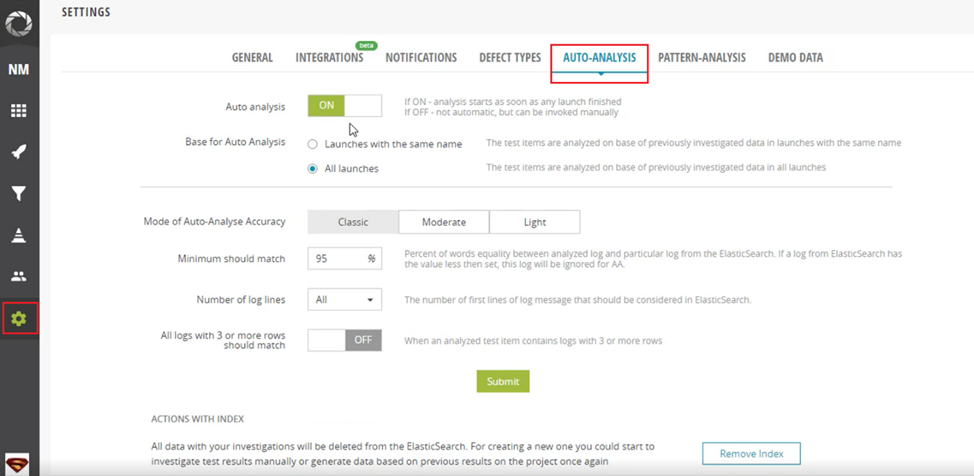
4.3 Turn on Auto-Analysis
4.4 Add dependency for ReportPortal
Add the dependency to pom file in our Maven project. It is to communicate with the ReportPortal from our test framework.
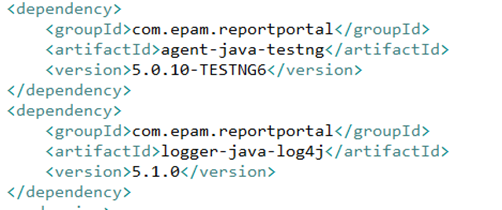
Please make sure that the version agent-java-testng version is compatible with the Test NG version we’re using in our project.
4.5 Add reportportal.properties file
Create a reportportal.properties in src/test/resources folder with the following content.
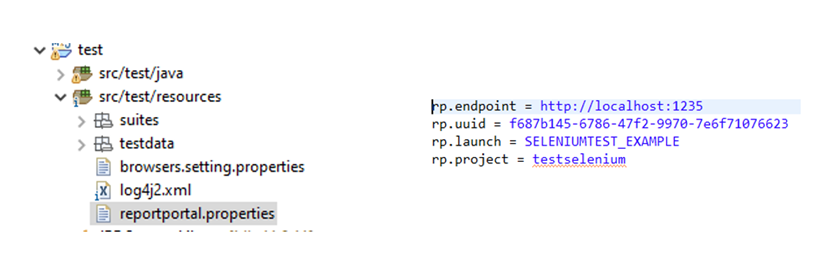
The information related to endpoint, uuid, launch or project will be get in section 4.3 above.
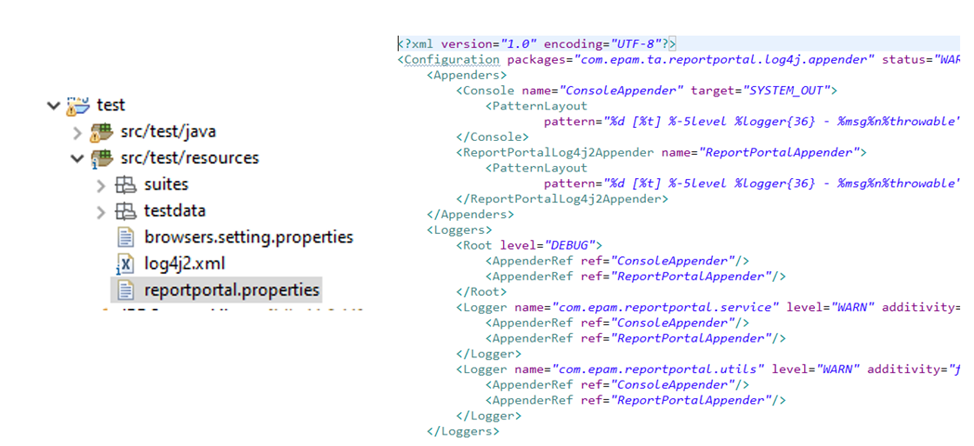
4.6 Add log4j2.xml file
Configure the log4j to write data to ReportPortal by creating log4j2.xml into src/test/resources folder with the following content.
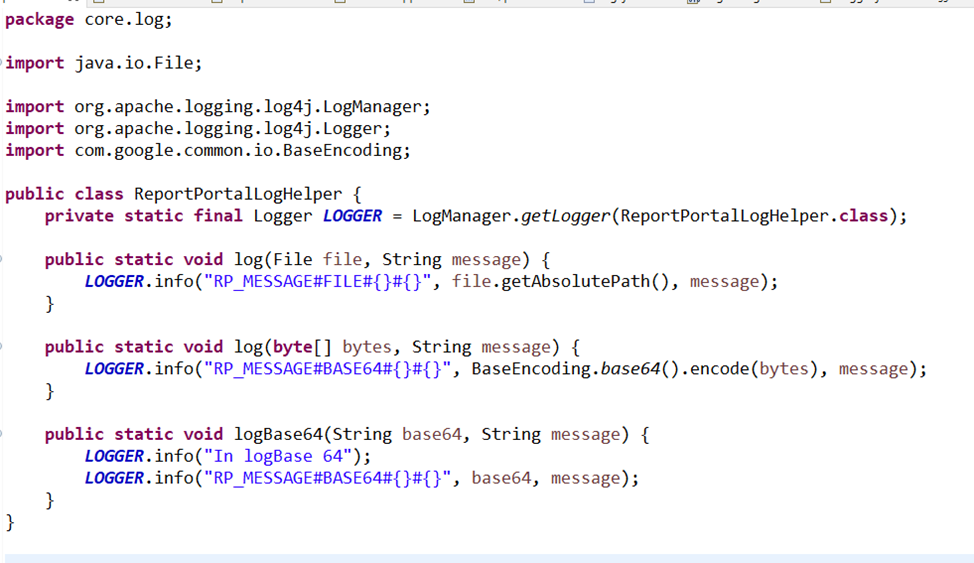
4.7 How to attach screenshot to ReportPortal
ReportPortalLogHelper class with following content for capturing the screenshot in Base64 format, and log with log4j.
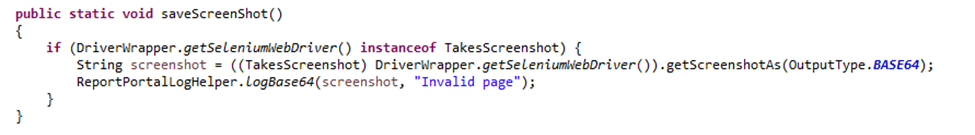
Implement function saveScreenshot to write screenshot into ReportPortal. To make sure that the output type should be Base64 when I call function getScreenshotAs of Selenium.
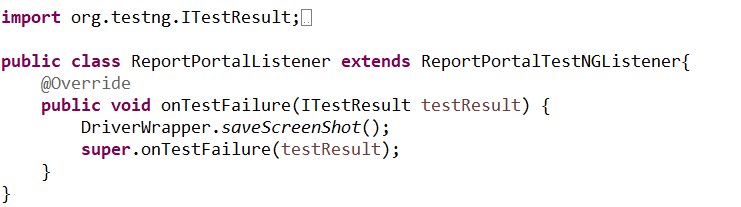
Create ReportPortalListener class: in my sample, I take a screenshot when the test is failed, so I create ReportPortalListener class to handle onTestFailure event.
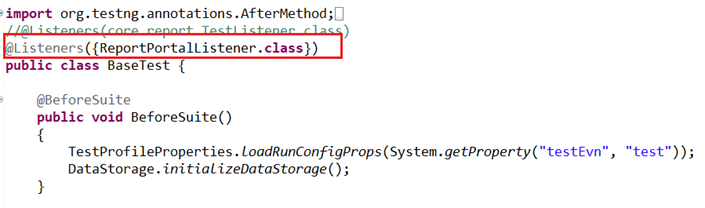
Add ReportPortalListener as test listener in our test class
Now, ReportPortal is using in the test report.
Conclusion
From my perspective, ReportPortal offers many features that greatly assist us in reducing result analysis time. By leveraging these capabilities, we can effectively shorten our release cycle, enabling us to deliver our product to clients earlier.
In case we encounter any challenges during setup or require customizations, ReportPortal provides various pricing plans tailored to our needs. By opting for a ReportPortal pricing plan, we gain access to infrastructure management, availability assurance, backups, version monitoring, and prompt support, allowing us to focus on our core tasks with peace of mind.
Reference: https://reportportal.io/