


Introduction
Nowadays, the need for tracing is not only from the backend microservices but also from the frontend. One of the most popular frameworks used to observe distributed systems is Opentelemetry (Otel). With the support of Otel libraries, we can easily trace the full flow from frontend to backend.
Usually, Otel-Collector and backend containers are deployed in the same private network so there is no problem with security. But to trace the frontend (from the client’s browser), we have to expose Otel-Collector receiver endpoint to the public network. A security mechanism is needed that only allows users with permission to send trace data. Otel-Collector provides an extension setting for its receiver to enable authentication. In this blog, we will use the OIDC Auth extension to secure the HTTP Receiver.
Local Deployment

The diagram describes the flows of components. Frontend first needs to log in to get an access token from Keycloak. The access token will be used as the Authorization Bearer token header in subsequence requests to send traces to Otel-Collector / call backend API via endpoints exposed by Nginx.
When Otel-Collector receives tracing requests from frontend, OIDC extension calls Keycloak to verify the token. If the token is valid, Otel-Collector will process, and export tracing data to Grafana Tempo.
There is no authentication for the backend Springboot service because it is deployed in the same private network as Otel-Collector.
Getting Started
1. Nginx hostnames
Add the following records to your host file
127.0.0.1 identity
127.0.0.1 be-java-tracing-demo
127.0.0.1 otel-collector
127.0.0.1 grafana
127.0.0.1 tempo
2. Start Docker containers
You can find the source code in nashtech garage https://github.com/nashtech-garage/Secure-Opentelemetry-FE-Tracing
Clone / download the source, go to Secure-Opentelemetry-FE-Tracing folder, and execute the command docker compose up to start containers that were defined in docker-compose.yml (Refer to /docker folder to see the configuration for each component)
- Proxy server Nginx: exposes URLs of Otel-Collector Receiver, Backend, and Keycloak outside the docker network.
- Keycloak URL: http://identity
- Backend URL: http://be-java-tracing-demo
- Otel-Collector Receiver URL: http://otel-collector
- Keycloak: Play the role of OAuth Server, used for frontend login and verify the access token. Pre-prepared realm data has also been imported. You can access http://identity with the Admin console to check.
- Console Admin: admin/admin
- Realm: opentelemetry
- Client: fe-demo
- User: test/password
- Opentelemetry Collector:
- Expose protocol gRPC (default port 4317) for Backend without Authentication
- Expose protocol HTTP (default port 4318) for Frontend with Authentication
- OIDC extension will extract the Authorization header from frontend requests, and then call Keycloak to verify the token. OIDC is only attached to the HTTP protocol as an authenticator.
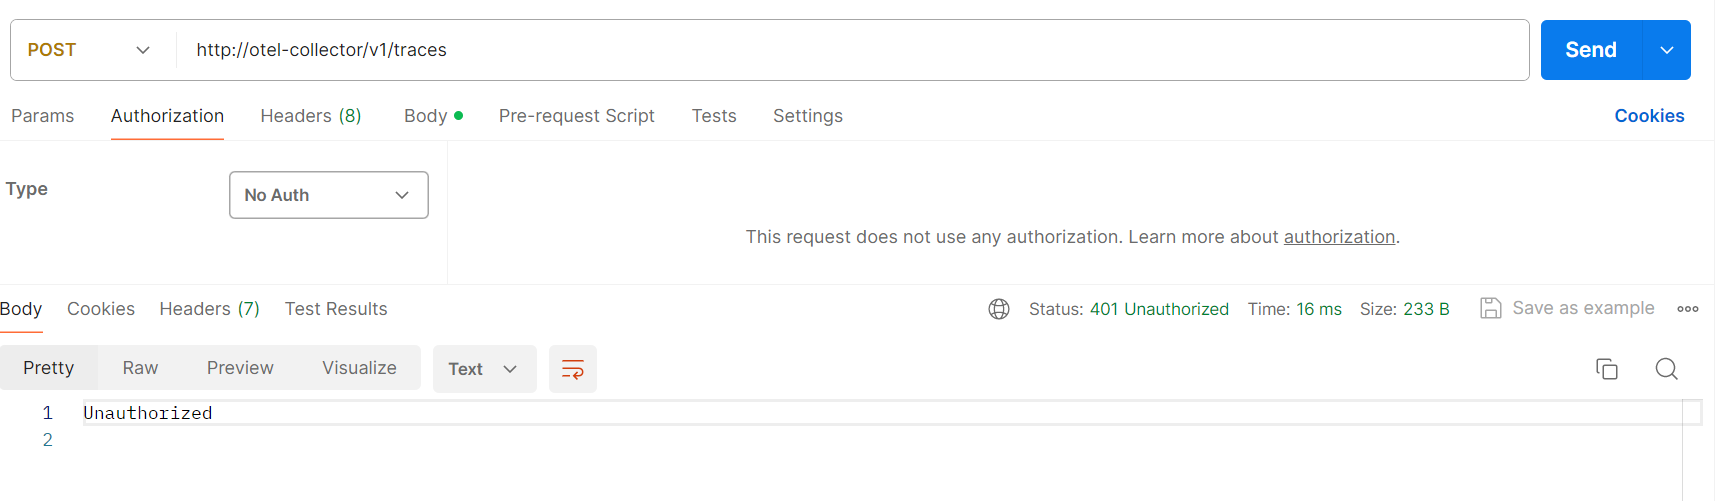
extensions:
  oidc:
    issuer_url: http://identity:8080/realms/opentelemetry
    audience: account
    attribute: Authorization

receivers:
  otlp:
    protocols:
      grpc:
      http:
        auth:
          authenticator: oidc
We can call the Otel-Collector receiver endpoint with No Auth to verify the OIDC authenticator. it responds 401 Unauthorized.

- Backend Java Springboot Service: Opentelemetry provides automatic instrumentation on Java applications. We only need to attach Java agent JAR when building the docker image. Java agent will send traces, logs, and metrics to Otel-Collector automatically. Refer to source /be-java-tracing-demo/Dockerfile or https://opentelemetry.io/docs/languages/java/automatic/ for more details
- Grafana Tempo: Distributed tracing backend, integrated with Grafana, ingest tracing data from Otel-Collector
- Grafana: To query, visualize trace data
3. Frontend Reactjs
Opentelemetry provides Javascript libraries to create TraceProvider, Exporter, and register automatic instrumentations such as API calls, document load, and user interactions… https://opentelemetry.io/docs/languages/js/getting-started/browser/
- Start frontend application
- Open frontend project folder /fe-reactjs-tracing-demo using Visual Studio Code (or any tool you are familiar with)
- Install npm i -f
- Start npm start
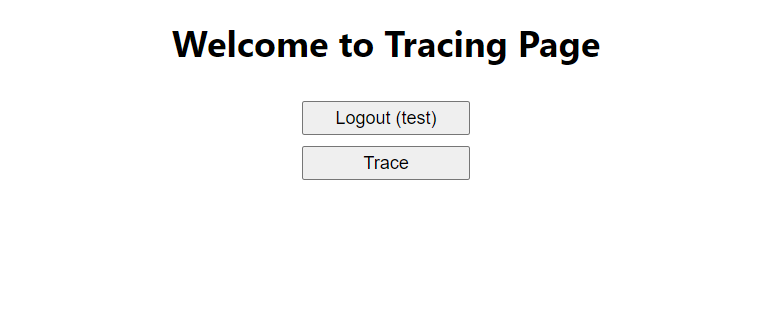
- Verify by accessing http://localhost:3000 . The home page simply displays a login button.


4. Test full tracing
- Click the Login button, log in with the user test/password
- After logged in successfully, the Trace button will appear
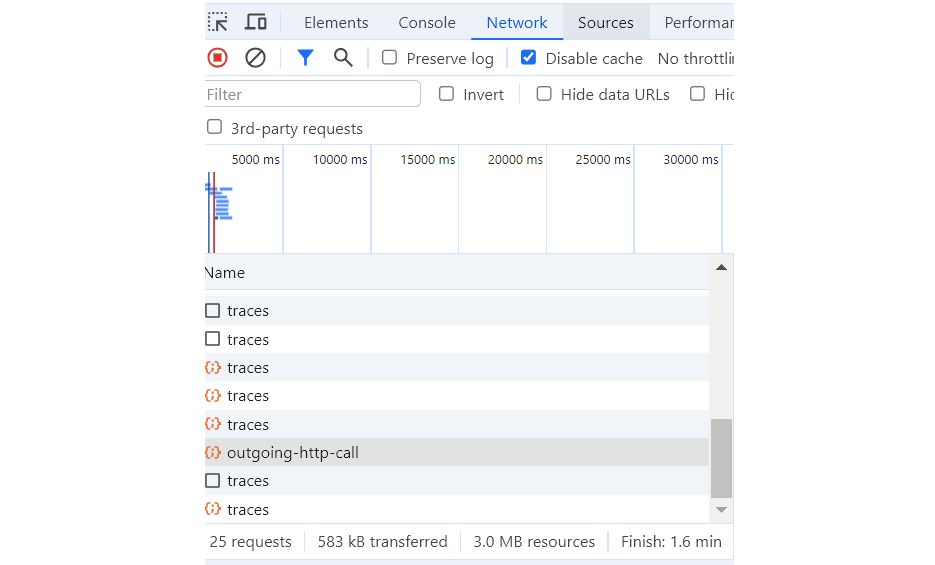
- Click the Trace button, and you will see in the Network tab there are some requests to Backend API /api/outgoing-http-call and Otel-Collector endpoint http://otel-collector/v1/traces
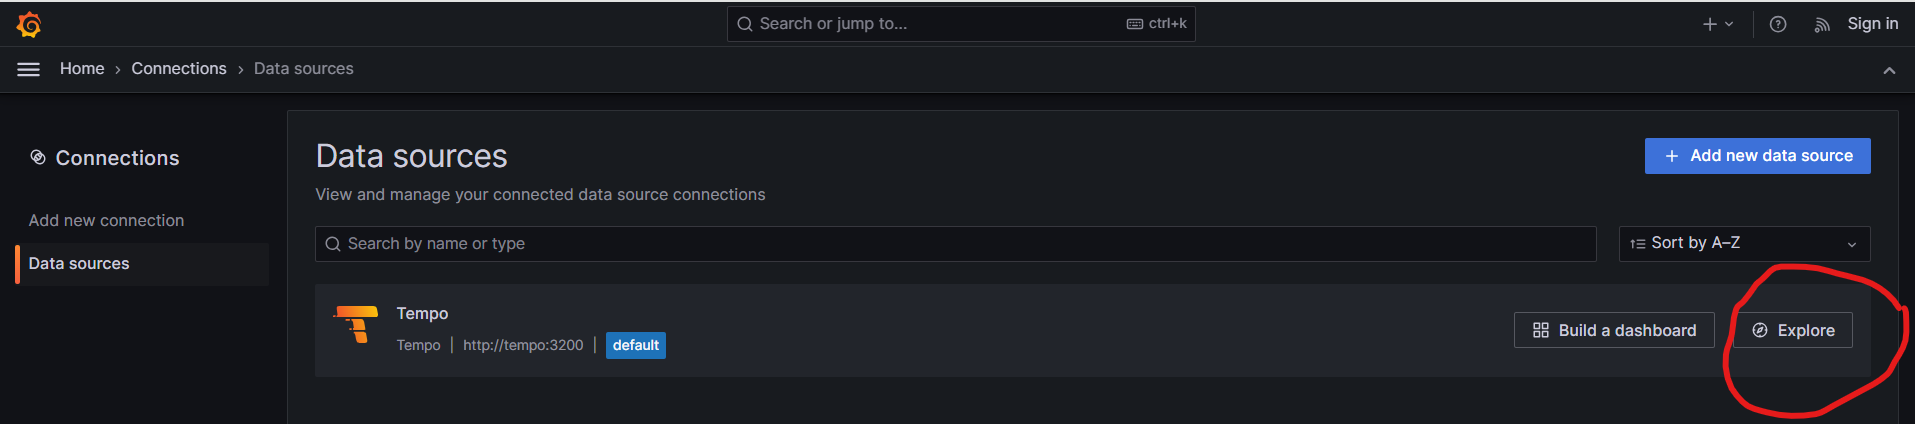
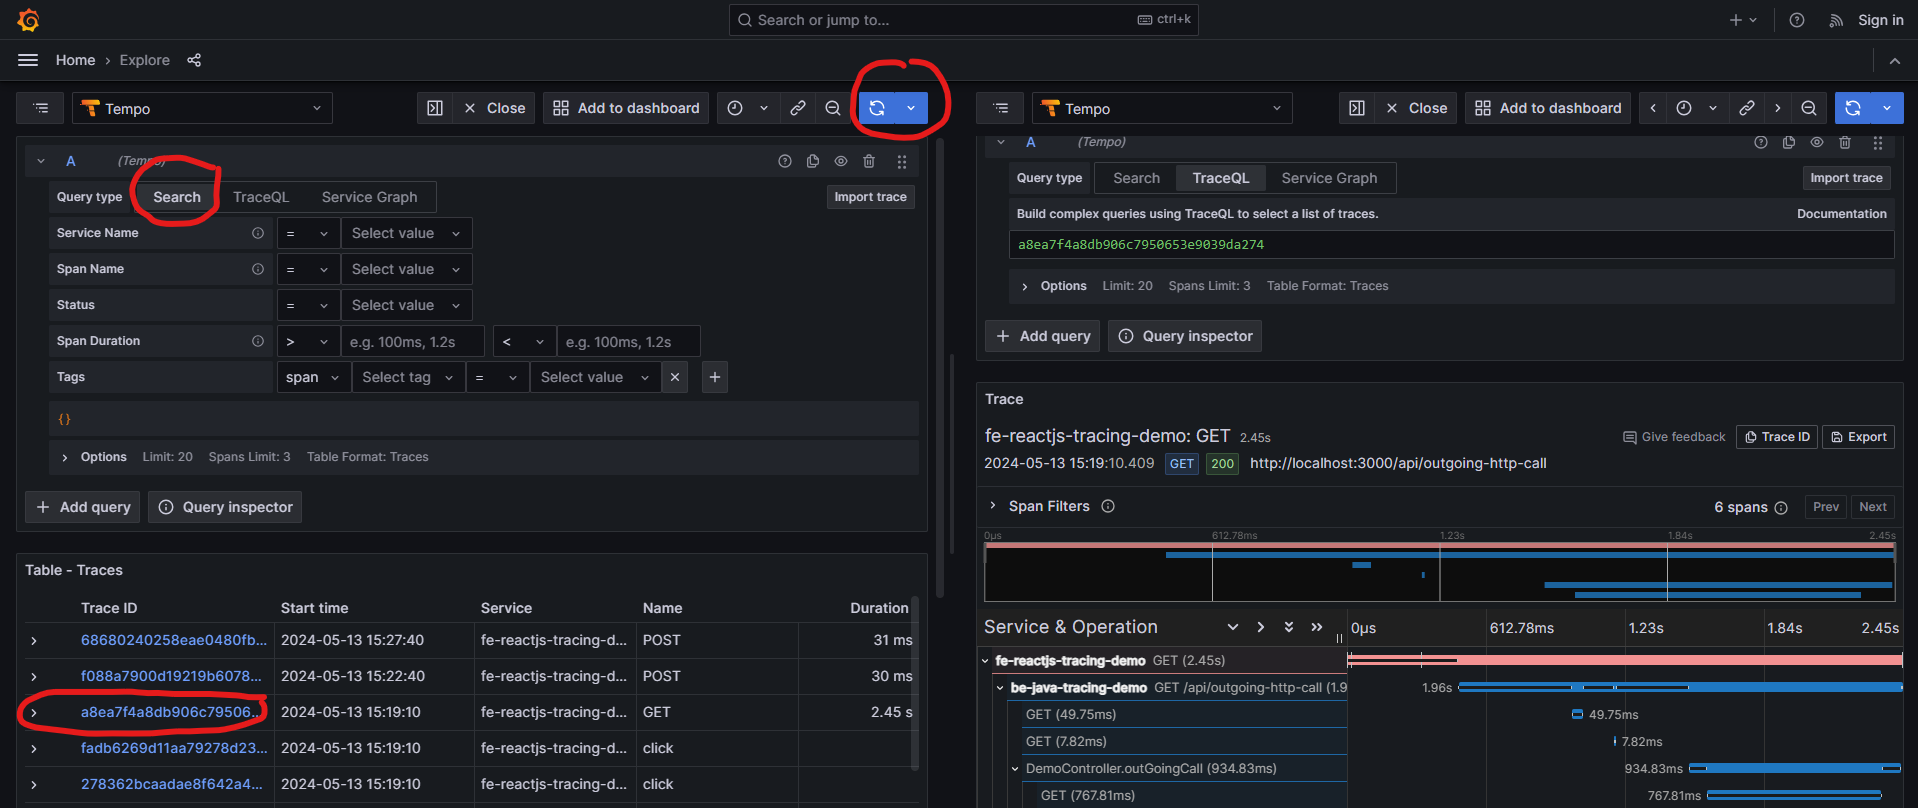
- Access Grafana http://grafana:4000/ . Home -> Connections -> Data Sources -> Tempo -> Explore

- Choose Search -> Run Query -> Select traceid with GET method, you will see a full trace from frontend to backend: fe-reactjs-tracing-demo -> be-java-tracing-demo -> http://google.com

Conclusion
Using the OIDC extension we can easily attach an authentication mechanism to the Opentelemetry Collector. This approach is not just for tracing but can also be applied to logs and metrics as they all pass through the receiver endpoints. On the Cloud for example AWS, we uses AWS Distro for OpenTelemetry Collector https://aws-otel.github.io/docs/getting-started/collector. Containers can be deployed on Elastic Container Service (ECS), using Cloudwatch X-ray instead of Grafana, Tempo. The result will be the same.
The example code can be found on GitHub – nashtech-garage/Secure-Opentelemetry-FE-Tracing