


Hello folks !!! Welcome back again with a new exciting topic. In this blog I will show you How you can setup Monitoring for ELK Stack .
Overview
Monitoring plays a crucial role in the next-generation API Gateway Platform. This document focuses on Setup monitoring for ELK Stack in which Logstash is monitored , as it plays a vital role in sending logs to Elasticsearch, which are visualised in Kibana using various indexes. When the Logstash service is down or stopped, logs cannot be sent to Kibana, impacting operations.
Monitoring Logstash and the EC2 instance where it’s deployed becomes essential for seamless functionality. The Jenkins Pipeline implemented here regularly checks Logstash and EC2 status, sending email notifications for any detected failures. This proactive monitoring and alerting system ensures the stability and availability of Logstash and the EC2 instance, facilitated through Jenkins automation.
The pipeline will check the EC2 instance’s health and Logstash service status regularly and send email notifications for the following scenarios:
- EC2 Instance is Not Running: If the EC2 instance is not in a “running” state, an email notification will be sent to notify the team.
- Logstash Service is Not Running: If the EC2 instance is running, but the Logstash service is not running, an email notification will be sent to alert the team.
- EC2 Instance is Unresponsive: If the EC2 instance is running but becomes unresponsive (hanged) and cannot be SSHed into, an email notification will be sent to notify the team.
Prerequisites
- AWS Account: Access to an AWS account with necessary permissions to manage EC2 instances.
- Jenkins Server: A Jenkins server set up and running with the required plugins installed (e.g., AWS SDK, logstash, office365Connector, SSH Agent Plugin).
- Jenkins Credentials: SSH private key credentials configured in Jenkins to securely connect to the EC2 instance.
- Logstash Instance: An Amazon EC2 instance with Logstash installed and running.
Steps for Monitoring Setup for ELK Stack
Follow these steps to Setup Monitoring for ELK stack :
STEP-1: Set Up AWS CLI
- Log in to the Jenkins server via SSH.
- Install the AWS CLI using the appropriate package manager for your OS using command below:
sudo apt-get install awscliStep 2: Create EC2 Instance and Configure ELK
Follow all the necessary steps to create an EC2 Instance and configure ELK on that machine which should be running.
Step 3: Configure Jenkins SSH Credentials
Now, we need to configure Jenkins to use SSH private key credentials to connect to the EC2 instance.
- Log in to the Jenkins server.
- Navigate to the Jenkins dashboard and click on “Credentials” in the left sidebar.
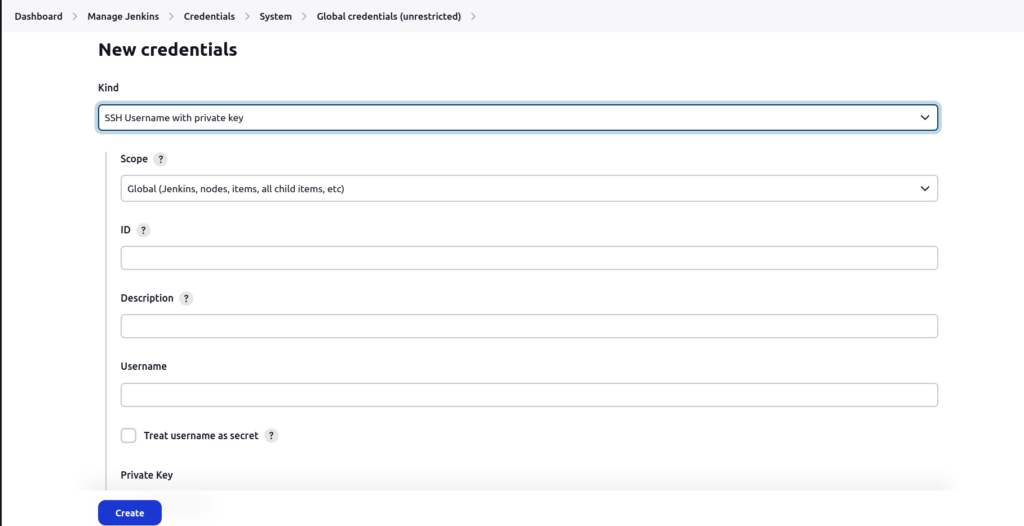
- Click on “Global credentials (unrestricted)”.
- Click on “Add Credentials”.
- Choose “SSH Username with private key” as the kind.
- Provide a username (e.g., “demo”) and paste the private key contents into the “Private Key” field.
- Click “OK” to save the credential
- Add the public key to the instance using command:
ssh-copy-id -i /path/to/private_key.pem ec2-user@EC2_INSTANCE_IPReplace the /path/to/private_key.pem, ec2-user, and EC2_INSTANCE_IP with the appropriate values of yours.
Step 4: Create the Jenkins Pipeline
Below is the Jenkins-Pipeline
pipeline {
agent {
label 'master_master'
}
environment {
WEBHOOK_URL = "your_webhook_url " // to send alert to office365 teams
}
triggers {
cron('H * * * *')
}
stages {
stage('Check Instance State and Logstash Status') {
steps {
withCredentials([sshUserPrivateKey(credentialsId: "id_rsa_logstash", keyFileVariable: 'logstash')]) {
script {
def instanceId = " your_instance_id" // Replace with your actual instance ID
def instanceState = sh(returnStdout: true, script: "aws ec2 describe-instances --instance-ids ${instanceId} --query 'Reservations[0].Instances[0].State.Name' --region your_aws_region").trim()
echo "Instance State: ${instanceState}"
if (instanceState == '"running"') {
echo "EC2 instance is running. Proceeding to check SSH connectivity..."
def sshTimeout = 60 // Timeout value in seconds
def sshCommand = " your path to the private key used for SSH connection 'echo SSH connection successful'"
def sshExitCode = sh(returnStatus: true, script: "timeout ${sshTimeout} ${sshCommand}")
if (sshExitCode == 0) {
echo "SSH connection successful. Proceeding to check Logstash status."
def logstashProcess = sh(returnStatus: true, script: " your path to the private key used for SSH connection 'pgrep -f ^/bin/java.*logstash'")
if (logstashProcess == 0) {
echo "Logstash is running"
} else {
echo "Logstash is not running"
def logstashStatus = "Logstash is not running"
def message = "Logstash Output:\n $logstashStatus"
def logstashLogFile = "Your path to logstash plain.log file "
// Read the logstash log file and append it to the message
message += "\n\nLogstash Log File:\n"
message += readFile(file: logstashLogFile)
office365ConnectorSend(
webhookUrl: "${env.WEBHOOK_URL}",
message: message,
status: 'Failed'
)
}
} else {
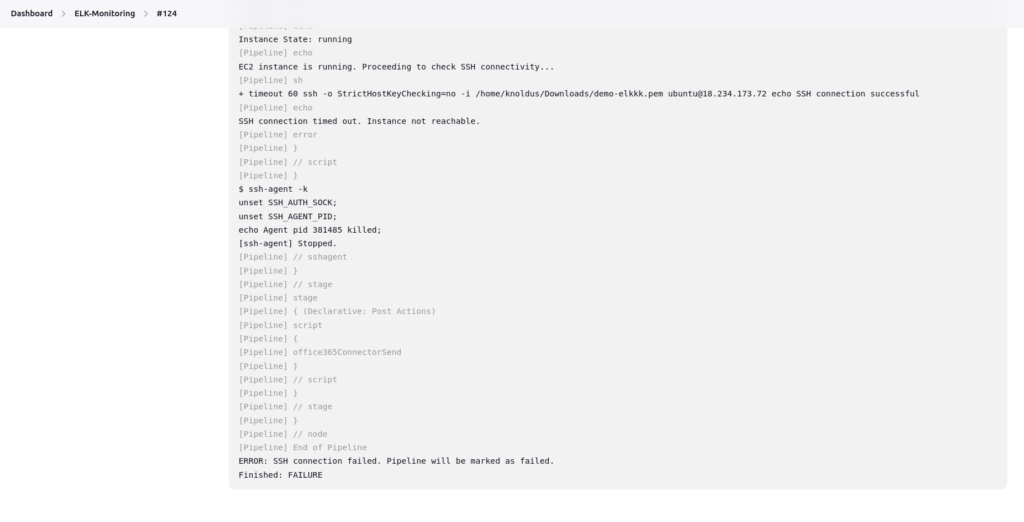
echo "SSH connection timed out. Instance not reachable."
error "SSH connection failed. Pipeline failed."
}
} else {
echo "EC2 instance is not running."
def instanceFailureMessage = "EC2 instance is not running"
def message = "Logstash Output:\n $instanceFailureMessage"
office365ConnectorSend(
webhookUrl: "${env.WEBHOOK_URL}",
message: message,
status: 'Failed'
)
}
}
}
}
}
}
post {
failure {
script {
def instanceFailureMessage = "EC2 instance is not responding (unresponsive and cannot SSH into it)"
def message = "Logstash Output:\n $instanceFailureMessage"
office365ConnectorSend(
webhookUrl: "${env.WEBHOOK_URL}",
message: message,
status: 'Failed'
)
}
}
}
}
- Log in to the Jenkins server “Dashboard”.
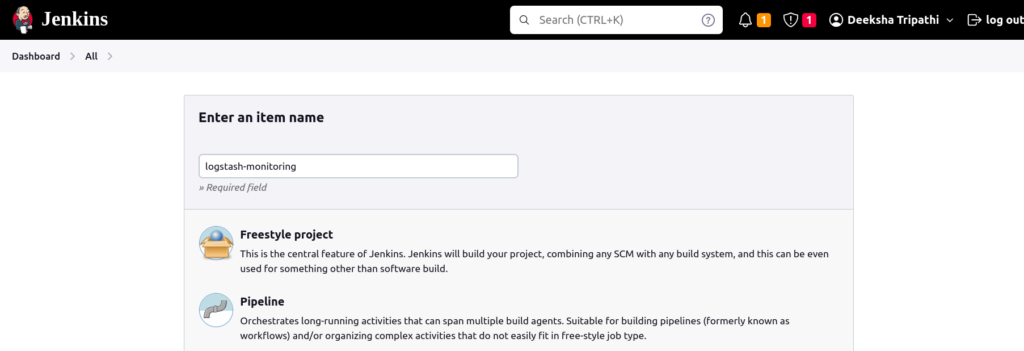
- Click on “New Item” to create a new Jenkins pipeline job.
- Enter a suitable name for the pipeline job (e.g., “Logstash Monitoring Pipeline”).
- Select “Pipeline” as the job type and click “OK”.
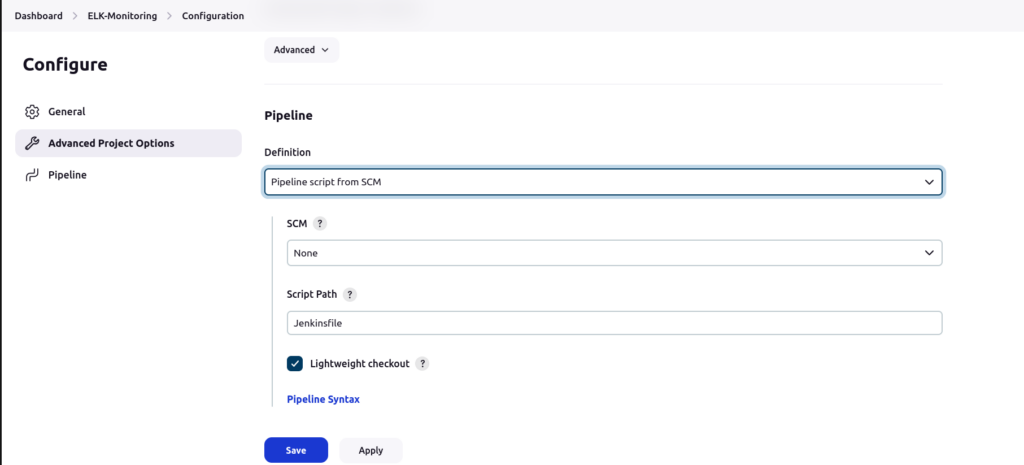
- In the pipeline configuration page, scroll down to the “Pipeline” section.
- Set the “Definition” to “Pipeline script from SCM”.
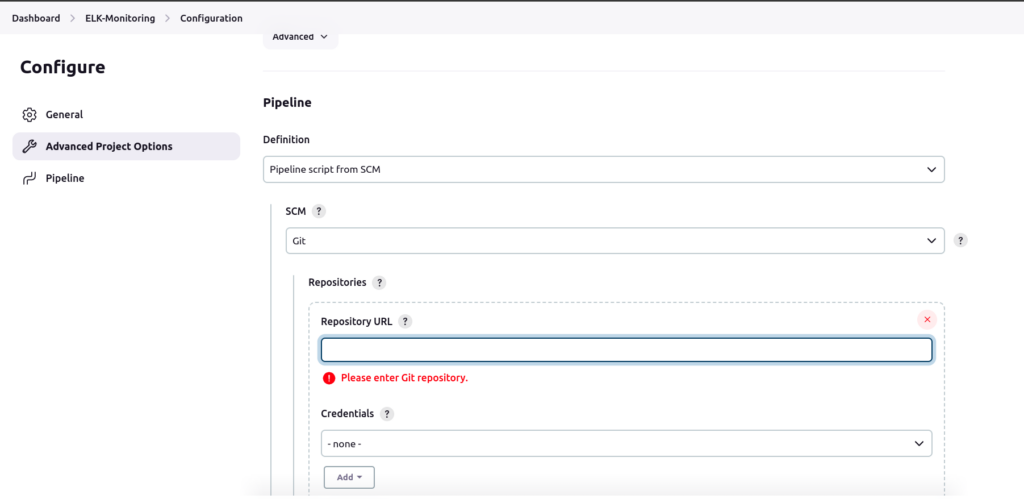
- Choose the appropriate SCM system (e.g., Git) and provide the repository URL containing the Jenkinsfile (pipeline script).
- Give the “Repository URL” & Add “Credentials” for git
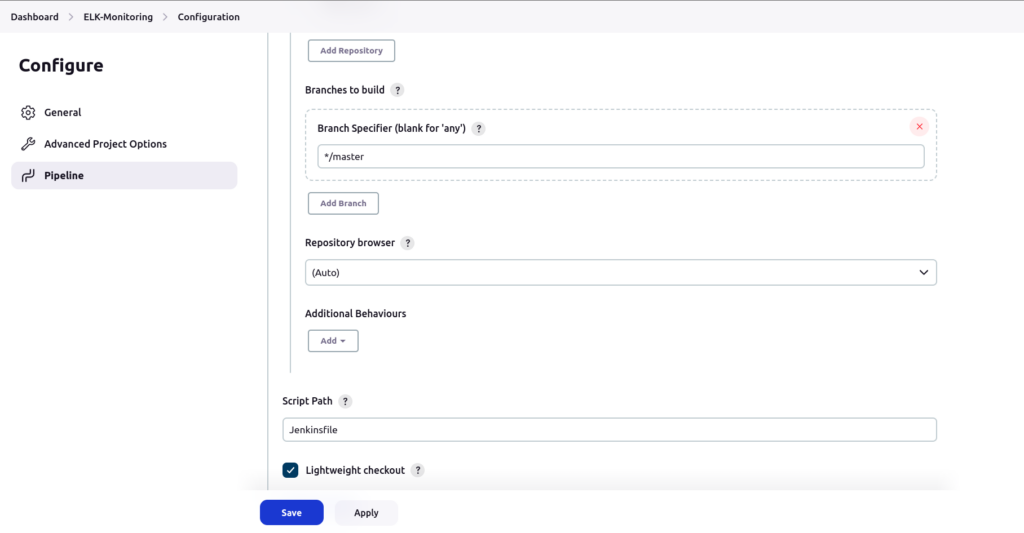
- Save the configuration by clicking on “Save”.
Step 5: Configure the Jenkinsfile
Update the below points in the pipeline
- instanceId: Replace with the actual EC2 instance ID.
- logstash: Update the path to the private key used for SSH connection.
Step 6: Save the configuration & trigger the Pipeline
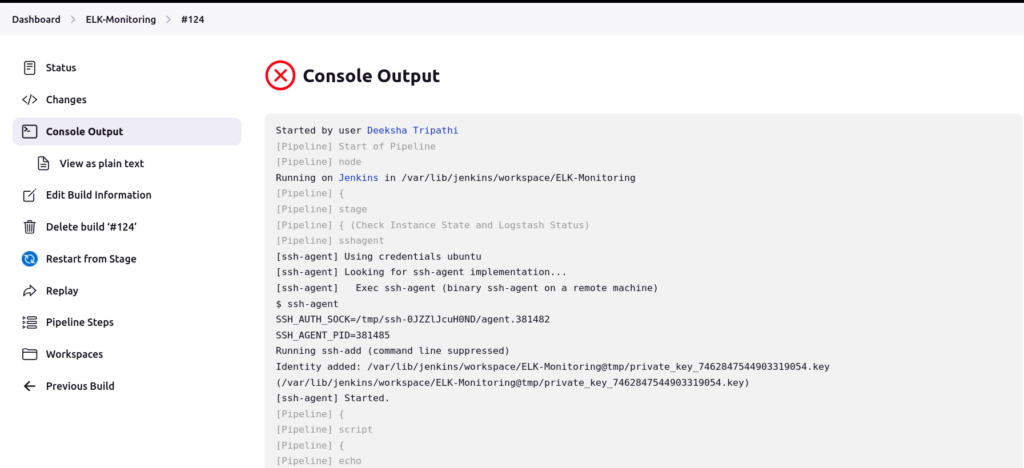
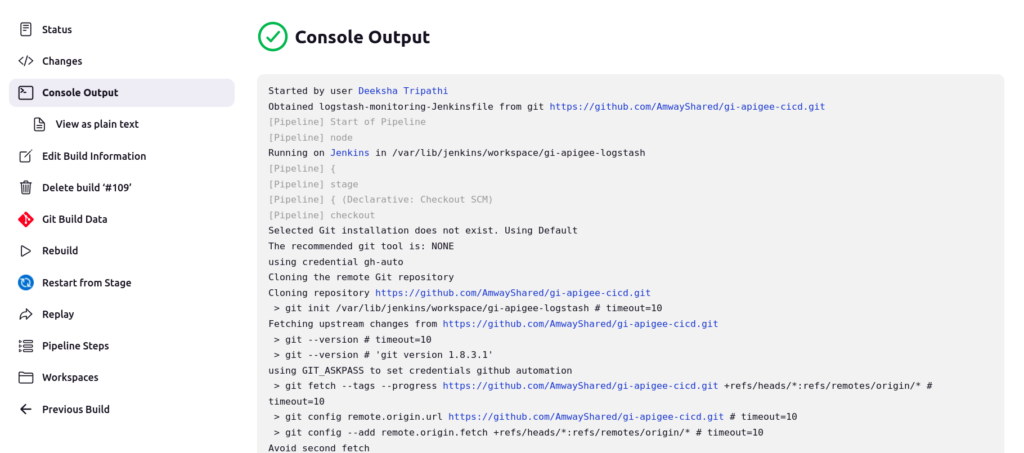
Save the Jenkins pipeline configuration and trigger the pipeline manually or schedule it to run periodically. Once you build the pipeline you will receive an output like below:
- For EC2 Instance is Unresponsive:
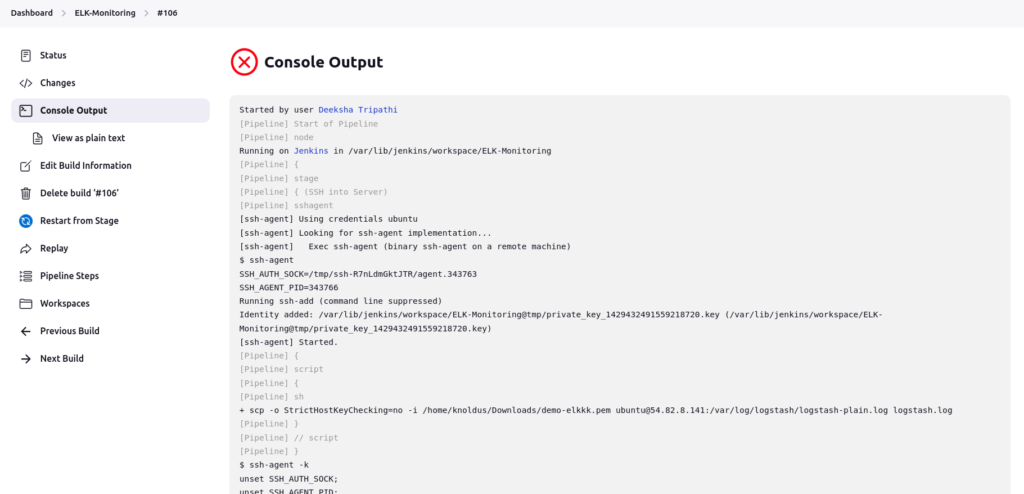
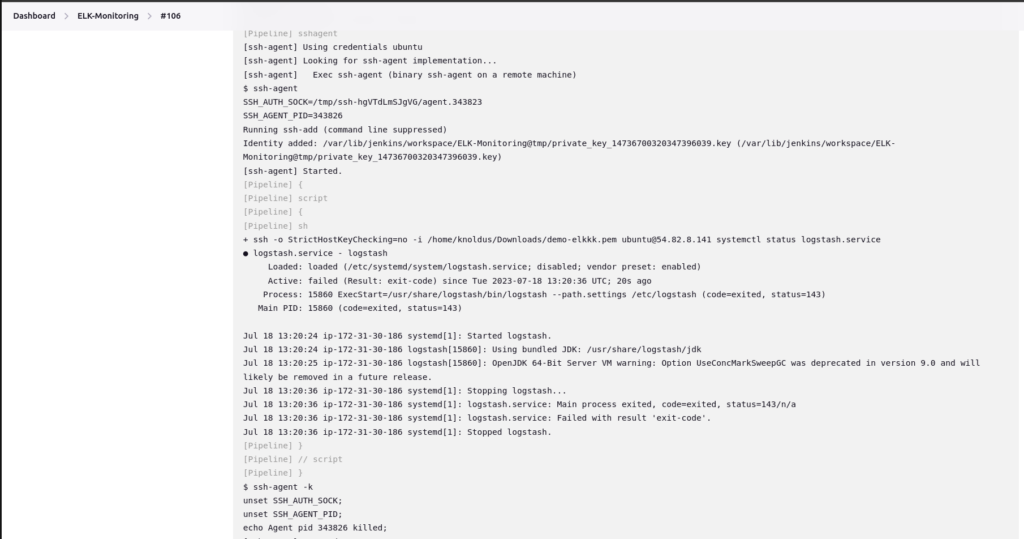
- Logstash Service is Not Running:
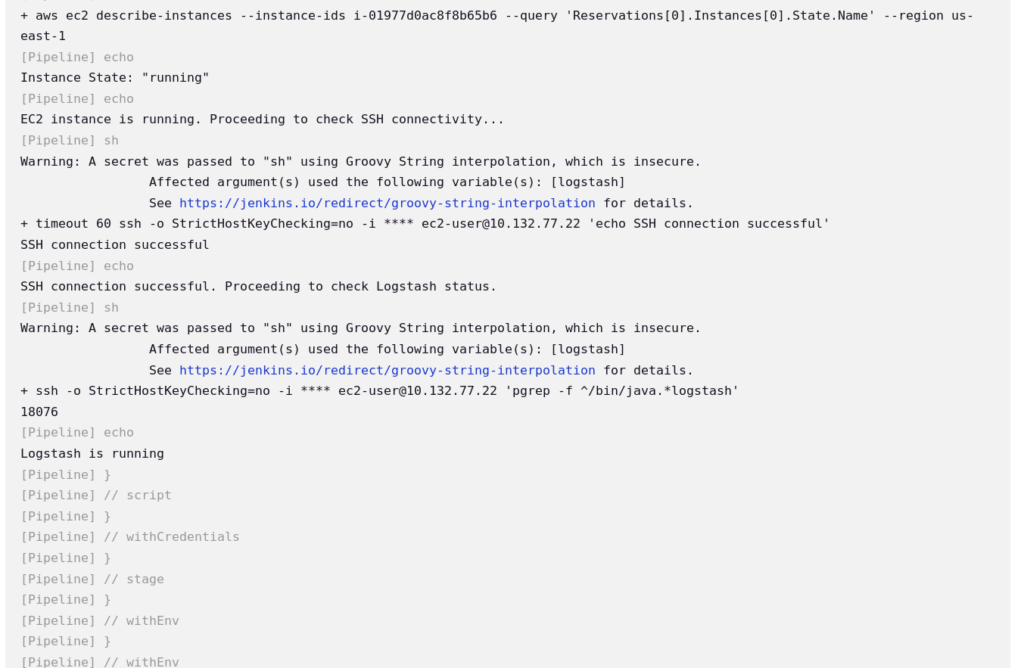
- If everything is OK and Running then you’ll receive an output like below:
Conclusion
So, this documentation provides the step-by-step instructions to set up an automated Jenkins pipeline for monitoring Logstash on an Amazon EC2 instance.The pipeline will periodically check the instance and Logstash status, and in case of any issues, it will notify the team through Office 365. This monitoring pipeline helps ensure the stability and performance of the Logstash environment.
Keep Growing !!!
Keep Learning !!!
Thank You 🙂