


Data Fundamentals
Definition and Importance of Data in Business
In business, data consists of raw facts, figures, and statistics gathered from various sources related to operations, customer interactions, market trends, and financial performance. This data includes both quantitative elements, such as sales figures or revenue, and qualitative elements, such as customer feedback or market sentiment.
Importance
- Informed Decision-Making: Data provides critical insights that facilitate informed decision-making. By analyzing trends, patterns, and anomalies, businesses can understand their performance and make strategic choices to drive growth.
- Customer Insights: Data offers a deep understanding of customer behavior, preferences, and needs. This information enables businesses to personalize marketing efforts, develop targeted products, and enhance customer service, ultimately boosting satisfaction and loyalty.
- Operational Efficiency: Data analysis reveals inefficiencies and optimizes processes, leading to better resource allocation and cost savings. Improved operational efficiency enhances overall productivity.
- Competitive Advantage: Companies that effectively utilize data gain a competitive edge. Data helps identify market opportunities, predict trends, and respond swiftly to changes, thereby staying ahead of competitors.
- Risk Management: Through data analysis, businesses can assess potential risks and uncertainties. Historical data and trend analysis enable companies to anticipate challenges and develop strategies to mitigate risks.
- Financial Performance: Analyzing financial data provides insights into profitability, cost structures, and overall financial health. This information is essential for accurate budgeting, forecasting, and financial planning.
- Innovation and Growth: Data-driven insights can spur innovation by uncovering new opportunities. Businesses can leverage this information to develop new products, enter new markets, and expand their offerings, thereby fostering growth.
Types of Data: Structured, Semi-Structured, and Unstructured
1. Structured Data
- Definition: Structured data is meticulously organized and readily searchable. It adheres to a predefined format or schema, such as rows and columns in a relational database or spreadsheets. This organization facilitates easy storage in databases or data warehouses, making the data highly accessible for querying and analysis.
- Examples: Examples include customer names, addresses, and transaction amounts stored in a relational database; data maintained in Excel spreadsheets; and information managed within SQL databases.
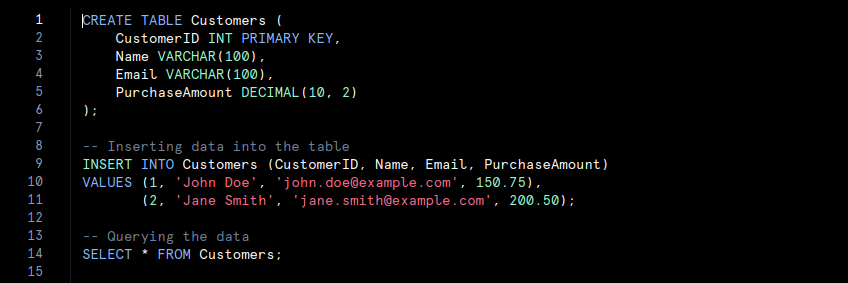
- In this code, a table named Customers is created with specific columns such as ‘CustomerID‘, ‘Name‘, ‘Email‘, and ‘PurchaseAmount‘. Data is inserted into the table and then queried. This organised structure allows for efficient data management and retrieval.
2. Semi-Structured Data
- Definition: Semi-structured data does not follow a rigid schema but still retains some organizational elements that simplify analysis compared to unstructured data. It often incorporates tags or markers to delineate elements and establish hierarchies, though it may not conform perfectly to table structures.
- Examples: Common examples include JSON or XML files, emails containing metadata, and CSV files with inconsistent formatting.

- In this code, JSON data is parsed using Python’s ‘json‘ module. The JSON format provides a flexible structure with hierarchical data. The code extracts and prints information about employees, demonstrating how semi-structured data can be managed and utilised.
3. Unstructured Data
- Definition: Unstructured data lacks a predefined format or structure, which makes analysis more complex. This data does not fit into traditional database tables and is frequently text-heavy or multimedia. Extracting meaningful insights from unstructured data requires advanced processing techniques, such as natural language processing or machine learning.
- Examples: Examples encompass text documents, social media posts, images, videos, and audio recordings.
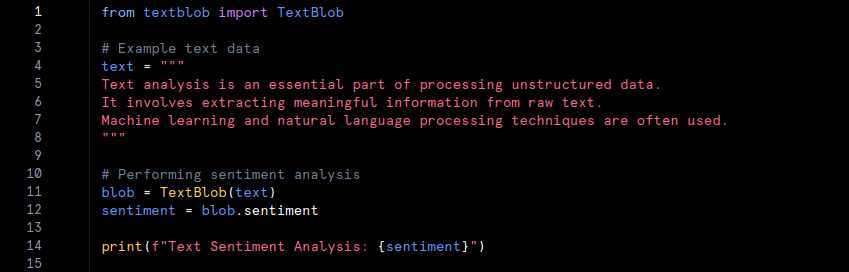
- In this example, unstructured text data is analysed using the ‘TextBlob‘ library. The text does not follow a specific format, and sentiment analysis is performed to extract meaningful insights. Advanced techniques, such as natural language processing, are employed to interpret unstructured data.
Data Storage: Relational Databases vs. Non-Relational Databases
1. Relational Databases
Relational databases store data in structured tables with rows and columns. Each table represents a specific entity, and relationships between tables are managed through keys. This organisation follows a fixed schema, which ensures data consistency and integrity.
- Characteristics:
- Schema-Based: Data is organized according to a predefined schema with fixed table structures. Altering the schema requires making changes to the database.
- ACID Compliance: Relational databases typically adhere to ACID (Atomicity, Consistency, Isolation, Durability) principles. This adherence ensures reliable transactions and maintains data integrity.
- SQL Query Language: Structured Query Language (SQL) is used to query and manage data. SQL provides powerful capabilities for executing complex queries and manipulating data.
- Examples: Popular relational databases include MySQL, PostgreSQL, Oracle Database, and Microsoft SQL Server.
- Use Cases: Relational databases are ideal for applications that require complex queries, transactional consistency, and well-defined data structures. Examples include financial systems, customer relationship management (CRM) systems, and inventory management.
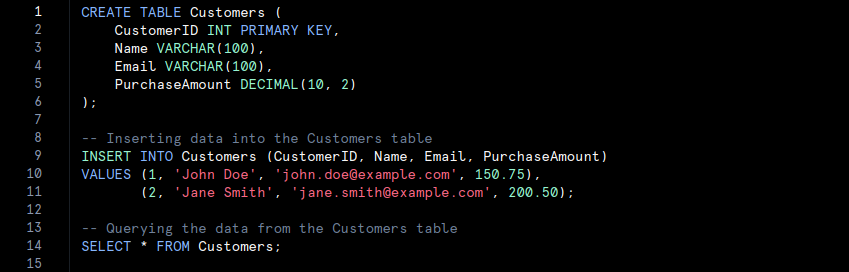
- The SQL code defines a table named Customers with specific columns. The INSERT statement adds records, and the SELECT statement retrieves the data. Relational databases utilise SQL for querying and managing structured data.
2. Non-Relational Databases
Non-relational databases, or NoSQL databases, store data in various formats such as documents, key-value pairs, wide-columns, or graphs. They offer flexible schema’s, accommodating diverse data types and structures.
- Characteristics:
- Schema-Less: Non-relational databases do not require a fixed schema. This flexibility supports dynamic data models and varying data formats.
- Scalability: Many NoSQL databases are designed for horizontal scaling, allowing them to handle large volumes of data across distributed systems. This scalability is advantageous for managing high-velocity data and large-scale applications.
- Data Models: Different NoSQL databases support various data models. For example, document-based databases like MongoDB, key-value stores like Redis, column-family databases like Apache Cassandra, and graph databases like Neo4j.
- Examples: Notable non-relational databases include MongoDB, Redis, Cassandra, and Neo4j.
- Use Cases: Non-relational databases are suited for applications requiring high scalability, flexible schema’s, and rapid data retrieval. They are often used in big data applications, content management systems, real-time analytics, and social networks.

The Python code connects to a MongoDB instance, selects a database and collection, and inserts documents. The find method retrieves data from the collection. MongoDB handles data in a flexible, document-oriented format.
Data Warehousing and Data Lakes
1. Data Warehousing
- Definition: Data warehousing refers to the practice of collecting, storing, and managing large volumes of structured data from various sources. A data warehouse acts as a centralized repository where data is consolidated, cleaned, and organized before being used for analysis and reporting.
- Characteristics:
- Schema-On-Write: In data warehousing, data is structured according to a predefined schema before being loaded into the warehouse. This schema defines how the data will be organized and accessed.
- ETL Process: The Extract, Transform, Load (ETL) process is employed to extract data from different sources, transform it into a consistent format, and load it into the warehouse. This process ensures data quality and consistency.
- Optimized for Querying: Data warehouses are optimized to handle complex queries and large-scale data analysis, making them suitable for business intelligence and reporting purposes.
- Examples: Examples of popular data warehousing solutions include Amazon Redshift, Google BigQuery, Snowflake, and Microsoft Azure Synapse Analytics.
- Use Cases: Data warehousing is ideal for applications that require extensive historical data analysis and reporting. It supports business intelligence functions such as financial analysis, sales reporting, and performance measurement.
SQL Data Warehouse
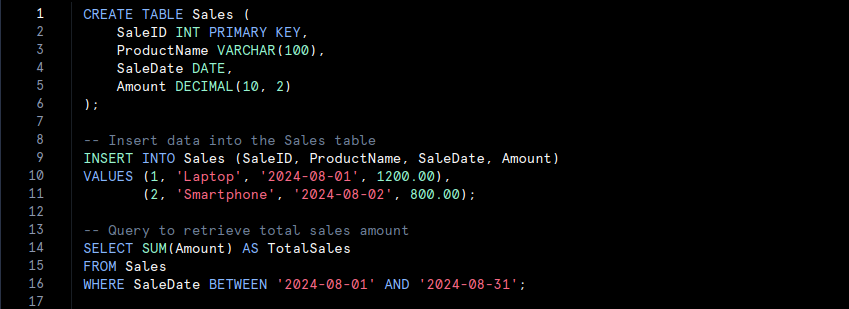
- We create a ‘Sales‘ table in a relational data warehouse, insert some sales data, and then run a query to calculate the total sales amount for August 2024.
2. Data Lakes
- Definition: A data lake is a storage repository that holds vast amounts of raw, unstructured, or semi-structured data in its native format. Unlike data warehouses, data lakes do not impose a predefined schema on the data. Instead, data is stored as-is and can be processed and analyzed later.
- Characteristics:
- Schema-On-Read: Data is stored in a raw format, and the schema is applied only when the data is read or processed. This approach allows for greater flexibility in data utilization.
- Scalability: Data lakes are designed to handle enormous volumes of data, including structured, semi-structured, and unstructured formats. They offer horizontal scalability, enabling them to grow with increasing data needs.
- Versatile Data Types: Data lakes accommodate a wide range of data types, such as text, images, videos, and log files. This versatility supports diverse analytics and machine learning applications.
- Examples: Notable data lake solutions include Amazon S3 with AWS Lake Formation, Google Cloud Storage with BigLake, Azure Data Lake Storage, and Hadoop Distributed File System (HDFS).
- Use Cases: Data lakes are well-suited for applications requiring flexible data storage and advanced analytics. They are commonly used for big data analytics, machine learning, and real-time data processing. Use cases include analyzing customer behavior, processing IoT data, and conducting exploratory data analysis.
Data Lake with Python and AWS S3

- We use the ‘boto3‘ library to interact with an AWS S3 data lake. We upload a CSV file (‘sales_data.csv’) to an S3 bucket and then download it back to the local filesystem as ‘download_sales_data.csv‘.
Data Processing: Batch Processing vs. Stream Processing, and ETL vs. ELT
Batch Processing vs. Stream Processing
1. Batch Processing
- Definition: Batch processing involves processing large volumes of data at scheduled intervals. Data is collected over a period, processed as a single batch, and analyzed in bulk. This method is well-suited for analyzing historical data and generating reports.
- Characteristics:
- Scheduled Intervals: Data is processed at predefined times, such as daily or weekly. This approach is less suited for real-time data needs.
- Historical Analysis: Batch processing is ideal for generating reports and performing analyses on historical data.
- Efficiency: Processing data in bulk can be more efficient for tasks that do not require immediate results.
- Example: Consider a retail company that processes sales data at the end of each day to generate daily sales reports. Here’s a pseudo-code example of batch processing:

2. Stream Processing
- Definition: Stream processing involves continuously processing real-time data as it arrives. This method is designed to handle high-velocity data and provide immediate insights, making it ideal for applications that require instant feedback.
- Characteristics:
- Real-Time Processing: Data is processed continuously, providing immediate insights and responses.
- High Velocity: Stream processing can handle large volumes of data in real time, supporting dynamic and time-sensitive applications.
- Immediate Insights: Suitable for scenarios where timely information is crucial, such as fraud detection or live traffic monitoring.
- Example: An example of stream processing is monitoring network traffic for security threats in real time. Here’s a pseudo-code example:

ETL vs. ELT Processes
1. ETL (Extract, Transform, Load):
- Definition: ETL is a process where data is extracted from various sources, transformed into a suitable format, and then loaded into a data warehouse for analysis. The transformation step occurs before the data is loaded into the warehouse.
- Characteristics:
- Transformation First: Data is transformed into a structured format before being loaded into the data warehouse.
- Data Preparation: Ensures that data is cleaned and formatted before analysis, improving data quality.
- Use Case: ETL is typically used when the destination is a structured data warehouse that requires data in a specific format.
- Example: In an ETL process, a company might extract customer data from multiple sources, clean and format it, and then load it into a data warehouse for reporting.

2. ELT (Extract, Load, Transform):
- Definition: ELT involves extracting data from sources and loading it directly into a data lake or data warehouse. The transformation occurs after loading the data, often within the data lake or warehouse itself.
- Characteristics:
- Loading First: Data is loaded in its raw form and then transformed as needed. This approach allows for flexible and on-demand transformation.
- Raw Data Storage: Suitable for scenarios where large volumes of raw data need to be stored before transformation.
- Use Case: ELT is commonly used with data lakes where large, unstructured datasets are stored and transformed later.
- Example: In an ELT process, raw sales data is loaded into a data lake, and specific transformations are applied only when necessary for analysis.

Data Modeling: Conceptual, Logical, and Physical Data Models
Conceptual, Logical, and Physical Data Models
a) Conceptual Data Model
- Definition: The conceptual data model offers a high-level view of the data requirements and relationships within a system. It outlines major entities and their relationships without detailing the technical aspects of implementation.
- Characteristics:
- High-Level Overview: It presents a broad understanding of data relationships and structures.
- No Implementation Details: The model avoids specifics about physical storage or technical details.
- Purpose: This model helps stakeholders grasp data requirements and business processes.
- Example: In an e-commerce system, the conceptual model identifies entities such as ‘Customer‘, ‘Order‘, and ‘Product‘ and shows relationships like customers placing orders and orders containing products.
b) Logical Data Model
- Definition: The logical data model provides a more detailed representation of data structures and relationships. It describes data elements and their relationships in depth but remains independent of physical storage considerations.
- Characteristics:
- Detailed Structure: It defines the structure and relationships of data elements clearly.
- Database-Independent: It does not include physical storage details or performance considerations.
- Purpose: It serves as a detailed blueprint for designing the physical database, ensuring data integrity and normalisation.
- Example: For the e-commerce system, the logical model specifies attributes such as ‘CustomerID‘, ‘CustomerName‘ and ‘OrderDate‘ and details relationships like the one-to-many relationship between ‘Customer‘ and ‘Order‘.
c) Physical Data Model
- Definition: The physical data model details how data is actually stored and accessed within a database. It includes specifics about tables, indexes, partitions, and other storage parameters.
- Characteristics:
- Implementation Details: It specifies physical storage structures and indexing strategies.
- Performance Considerations: It addresses how data storage and access are optimized for performance.
- Purpose: It guides the actual creation and maintenance of the database.
- Example: In the physical model for the e-commerce system, you might define tables like ‘Customers‘ and ‘Orders‘ with specific columns, indexes on ‘CustomerID‘ and data types such as ‘VARCHAR‘ or ‘DATE‘.
Schema Design
a) Star Schema
- Definition: The star schema is a database design that features a central fact table connected to dimension tables. This layout simplifies queries and is commonly used in data warehousing for reporting and analysis.
- Characteristics:
- Central Fact Table: This table contains quantitative data, such as sales amounts or transaction counts.
- Dimension Tables: These tables store descriptive attributes related to the fact table, like ‘Date‘, ‘Product‘ and ‘Customer‘.
- Simplified Queries: The structure supports straightforward querying and data aggregation.
- Example: In a sales data warehouse, a star schema may include a central ‘SalesFact‘ table with measures like ‘TotalSales‘ and ‘QuantitySold‘ linked to dimension tables such as ‘ProductDimension‘, ‘TimeDimension‘ and ‘CustomerDimension‘.
b) Snowflake Schema
- Definition: The snowflake schema is a variation of the star schema where dimension tables are normalized into multiple related tables. This design reduces redundancy but increases complexity.
- Characteristics:
- Normalized Dimensions: Dimension tables are split into multiple related tables to minimize data duplication.
- Increased Complexity: The normalized structure can make queries more complex compared to a star schema.
- Reduced Redundancy: It helps maintain data integrity and reduce storage costs.
- Example: In a sales data warehouse using a snowflake schema, the ‘ProductDimension‘ table might be divided into ‘ProductCategory‘, ‘ProductSubCategory‘, and ‘ProductDetails‘ tables, which are interconnected.
Data Security and Privacy: Encryption, Masking, and Data Governance
Data Encryption and Masking
1. Encryption
- Definition: Encryption is the method used to convert data into a secure format that only authorized users can access. By applying encryption algorithms and keys, the data becomes unreadable to anyone who does not possess the correct decryption key.
- Characteristics:
- Secure Format: Data is transformed into an unreadable format using cryptographic algorithms.
- Authorized Access Only: Only users with the correct decryption key can convert the data back to its original form.
- Purpose: Encryption protects both data at rest (when stored) and data in transit (when being transmitted), thereby safeguarding it from unauthorized access and theft.
- Example: For instance, if a company needs to secure customer information such as Social Security numbers, it can use encryption. In Python, the ‘cryptography‘ library can be used for this purpose:

2. Masking
- Definition: Masking involves replacing sensitive data with anonymized or obfuscated values. This process ensures that while the data remains usable for purposes such as testing or analysis, the actual sensitive information is protected.
- Characteristics:
- Anonymization: Sensitive data is obscured with non-sensitive values that maintain the format and structure of the original data.
- Privacy Assurance: Even if the masked data is accessed, the sensitive information remains hidden.
- Purpose: Masking allows organizations to use data in development or testing environments without exposing confidential information.
- Example: For example, a company might mask Social Security numbers in a test database while preserving the format. Here is a simple Python example demonstrating data masking:

Data Governance and Compliance
1. Data Governance
- Definition: Data governance encompasses the policies, procedures, and standards that guide how data is managed within an organization. It includes practices for ensuring data quality, data management, and stewardship.
- Characteristics:
- Policy Enforcement: Establishes guidelines for data handling and management.
- Data Quality Assurance: Ensures data is accurate, consistent, and reliable.
- Accountability: Defines roles and responsibilities for managing data.
- Purpose: Effective data governance helps organizations manage their data assets efficiently, ensuring high-quality data and adherence to best practices.
2. Compliance
- Definition: Compliance involves adhering to legal regulations and standards designed to protect data privacy and integrity. Key examples include GDPR (General Data Protection Regulation) and HIPAA (Health Insurance Portability and Accountability Act).
- Characteristics:
- Regulatory Adherence: Ensures that data management practices meet legal and regulatory requirements.
- Privacy Protection: Safeguards personal and sensitive information from misuse or unauthorized access.
- Audit and Reporting: Includes mechanisms for auditing practices and reporting on compliance status.
- Purpose: Compliance ensures that organizations follow legal and ethical standards for data management, protecting individuals and the organization from potential data breaches and privacy violations.
Big Data Technologies: Cloud-Based Data Solutions
Cloud-Based Data Solutions
Definition: Cloud-based data solutions harness the power of cloud platforms like Azure, AWS (Amazon Web Services), and Google Cloud to offer scalable and flexible options for data storage and processing. These platforms deliver a broad range of services designed to meet various data needs, from basic storage to sophisticated analytics and machine learning.
Characteristics:
- Scalability: Cloud platforms provide dynamic scaling capabilities. As data volumes increase or processing requirements expand, users can easily allocate additional resources. This feature ensures that organisations can manage large datasets efficiently without being constrained by physical hardware limitations.
- Flexibility: Cloud solutions offer an array of services that can be customized to fit specific needs. Whether for data warehousing, real-time analytics, or advanced machine learning, cloud platforms provide versatile tools that adapt to evolving requirements.
- Cost Efficiency: Many cloud-based solutions operate on a pay-as-you-go basis. This model allows organizations to pay only for the resources they actually use, making it a more cost-effective option compared to maintaining on-premises infrastructure.
- Accessibility: Data stored in the cloud is accessible from anywhere with an internet connection. This global accessibility supports remote work and facilitates collaboration among team members across different locations.
Examples:
- Azure: Microsoft’s cloud platform provides services such as Azure Data Lake Storage for handling big data, Azure SQL Database for managing relational data, and Azure Synapse Analytics for integrated analytics solutions.
- AWS: Amazon Web Services offers tools like Amazon S3 for scalable storage, Amazon Redshift for data warehousing, and Amazon EMR for processing large data sets using Hadoop and Spark.
- Google Cloud: Google Cloud features services such as Google BigQuery for large-scale data analysis, Google Cloud Storage for reliable data storage, and Google Cloud Dataproc for managing Hadoop and Spark clusters.
Example Code for Cloud Storage:
Here is a simple Python example showing how to upload a file to AWS S3 using the boto3 library:

Data Analytics: Types of Analytics and the Role of BI Tools
Types of Analytics
1. Descriptive Analytics
- Definition: Descriptive analytics involves analyzing historical data to understand what has happened in the past. This method summarizes past events and trends to provide a clear view of historical performance.
- Purpose: It aims to highlight patterns, trends, and key metrics from past data, allowing organizations to review and understand historical performance.
- Example: For instance, a retail company may use descriptive analytics to examine past sales data. This analysis helps the company identify seasonal purchasing patterns and overall sales performance.
2. Diagnostic Analytics
- Definition: Diagnostic analytics investigates data to determine the reasons behind past events. It delves deeper than descriptive analytics to uncover the causes of specific outcomes or anomalies.
- Purpose: By exploring the data, this type of analysis identifies the factors that contributed to certain results, providing insights into why particular trends or issues occurred.
- Example: If a company notices a sudden drop in sales, diagnostic analytics can analyze various data points, such as marketing efforts, customer feedback, and market conditions, to identify the root cause of the decline.
3. Predictive Analytics
- Definition: Predictive analytics uses historical data and machine learning techniques to forecast future trends and events. It builds models based on past data to predict what is likely to happen in the future.
- Purpose: This analysis helps organizations anticipate future scenarios, enabling them to plan and make decisions based on expected outcomes.
- Example: An e-commerce company might employ predictive analytics to estimate future sales. This involves analyzing historical purchase patterns and other relevant factors to forecast future buying trends.
4. Prescriptive Analytics
- Definition: Prescriptive analytics provides recommendations on actions to take in order to achieve desired outcomes. It uses insights from predictive models and optimization techniques to suggest the best possible actions.
- Purpose: This analysis guides decision-making by offering actionable recommendations based on predictions and potential future scenarios.
- Example: A logistics company might use prescriptive analytics to determine the most efficient delivery routes. This analysis takes into account factors like traffic patterns, weather, and deadlines to suggest optimal routes.
Role of BI Tools
Business Intelligence (BI) Tools
- Definition: Business Intelligence tools, such as Power BI and Tableau, are software applications designed for data visualization and analysis. They transform raw data into meaningful insights through interactive dashboards, charts, and reports.
- Purpose: BI tools help organizations visualize their data, identify trends, and generate reports, facilitating informed decision-making. These tools provide real-time access to data, enabling users to interact with and analyze complex information effectively.
- Examples:
- Power BI: This Microsoft tool offers interactive visualizations and business intelligence features with a user-friendly interface. Users can create detailed reports and dashboards from diverse data sources.
- Tableau: Known for its robust data visualisation capabilities, Tableau allows users to create interactive and shareable dashboards, uncovering insights and supporting data-driven decisions.
Conclusion
Data analytics and storage technologies are vital for modern businesses. Relational databases handle structured data, while non-relational databases offer flexibility for diverse data types. Data warehousing and data lakes manage historical and real-time data respectively. Batch and stream processing address different data handling needs, and ETL and ELT streamline data integration and transformation. Data modeling and schema designs optimize data organization and retrieval, while encryption and masking ensure security and compliance. Cloud platforms provide scalable data solutions, and BI tools like Power BI and Tableau facilitate effective data visualization and decision-making. Together, these technologies enable efficient data management and drive business growth.