


In the dynamic landscape of modern software architecture, distributed systems have become the backbone of many applications. As these systems evolve, so do the challenges associated with understanding how different components interact and contribute to the overall performance. This is where distributed tracing comes into play, offering a solution to gain insights into the intricacies of requests as they traverse through various microservices. In this beginner’s guide, we’ll explore the fundamentals of distributed tracing using Jaeger, a powerful open-source tracing system.
What is Distributed Tracing?
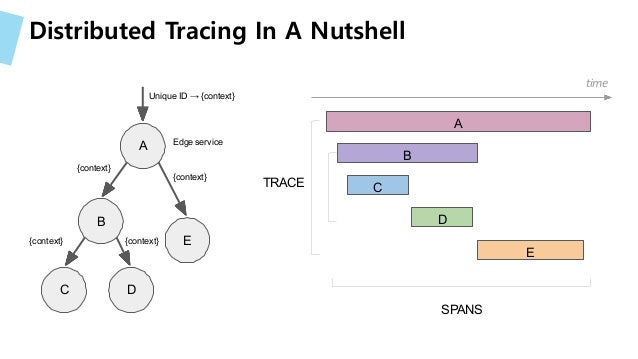
Distributed tracing is a technique that allows you to track the journey of a single user request as it flows through a network of interconnected services. In a microservices architecture, a single user action, such as clicking a button on a web application, can trigger a series of interactions between multiple services. These interactions can span different servers, databases, and even geographical regions. Distributed tracing helps developers and operators visualize and analyze the path that a request takes, providing insights into latency, errors, and dependencies.
The Need for Distributed Tracing
As systems become more complex, understanding the performance and behavior of individual components and their interactions becomes challenging. Traditional monitoring tools might provide aggregated metrics, but they often lack the granularity required to pinpoint the root cause of latency or errors. Distributed tracing fills this gap by offering a detailed view of how requests propagate through the system. This visibility is crucial for diagnosing performance bottlenecks, optimizing resource utilization, and enhancing user experiences.
Introducing Jaeger: An Open-Source Tracing System
Jaeger is an open-source, end-to-end distributed tracing system created by Uber Technologies. It is designed to provide visibility into the flow of requests across services in a microservices architecture. Jaeger captures trace data, which includes information about the different components involved in processing a request, the time taken at each step, and any errors encountered.
Key Components of Jaeger
- Trace: A trace represents the complete path of a user request as it traverses through various services. It is composed of multiple spans.
- Span: A span represents a single operation within a trace. It includes information such as the start and end times, the service handling the operation, and any associated tags and logs.
- Service: A service is a component that performs a specific role in the application. Each service generates spans as it processes requests.
- Tag: A tag is a key-value pair that provides metadata about a span. It can include information like HTTP status codes, error messages, and more.
- Trace Context: Trace context contains information required to connect related spans into a trace. It includes a trace ID, span ID, and other context information.
How Jaeger Works
Jaeger functions by instrumenting your code to capture trace data. It provides libraries and integrations for various programming languages and frameworks, allowing you to add tracing to your services. When a request enters a service, Jaeger creates a new span to represent that operation. As the request propagates through different services, each service generates its own span. Jaeger ensures that spans are correlated correctly by maintaining trace context using trace and span IDs. It operates by instrumenting your codebase, allowing you to collect and visualize trace data for requests as they traverse through your microservices ecosystem. The process involves several key components and steps:
1. Instrumenting Code
Instrumentation is the process of adding tracing-related code to your services. Jaeger provides libraries and integrations for various programming languages and frameworks, making it easier to incorporate tracing into your existing codebase. When you instrument your code, you essentially add hooks that create and manage spans, representing the individual operations within a trace.
2. Generating Spans
When a user request enters a service, Jaeger generates a new span to encapsulate the operation performed by that service. Spans can represent various types of operations, such as handling an HTTP request, querying a database, or invoking an external API. Each span contains metadata about the operation, including its start and end times, the service that handled it, and any associated tags or logs.
3. Maintaining Trace Context
A crucial aspect of distributed tracing is maintaining trace context. Since a single request can span multiple services, it’s essential to correlate spans and group them into a coherent trace. Jaeger achieves this by using trace and span IDs. When a request propagates from one service to another, the trace context is passed along, allowing Jaeger to establish the relationship between spans and reconstruct the entire trace.
4. Propagation and Communication
As requests move between services, trace context information is propagated. This information typically includes the trace ID, span ID, and other relevant data. Services use this context to create new spans and ensure that they are linked to the correct trace. Propagation can occur through various mechanisms, such as HTTP headers, making it possible for services to communicate trace context seamlessly.
5. Data Collection and Storage
The trace data generated by instrumented services is collected by Jaeger’s collector component. The collector aggregates trace data from multiple services and forwards it to the storage backend, where it is stored for analysis. The storage backend can be a database, such as Elasticsearch, that enables efficient querying and retrieval of trace data.
6. Visualization and Analysis
Once trace data is stored, you can access the Jaeger user interface to visualize and analyze traces. The UI provides a graphical representation of traces, showing the sequence of spans and their timings. This visualization helps you understand the journey of requests and identify potential bottlenecks or issues. By examining the interactions between services and the time taken at each step, you can gain insights into the behavior of your distributed system.
7. Root Cause Analysis and Optimization
With trace data readily available, you can perform root cause analysis when issues arise. If a request experiences high latency or encounters errors, you can trace its path through the system to pinpoint the exact service or component responsible. This information empowers you to address performance bottlenecks, optimize critical paths, and enhance the overall efficiency of your microservices architecture.
Analyzing Traces in Jaeger
Once you have traces captured by Jaeger, you can use the Jaeger user interface to analyze them. The Jaeger UI provides a visual representation of traces, showing the sequence of spans and the time taken at each step. You can identify performance bottlenecks, view error messages, and understand the dependencies between services.
Benefits of Using Jaeger
1. Performance Optimization
Distributed systems are inherently complex, and identifying performance bottlenecks can be challenging. Jaeger’s distributed tracing capabilities allow you to pinpoint precisely where requests are spending the most time within your microservices architecture. By analyzing trace data, you can identify slow components, latency hotspots, and areas that require optimization. This knowledge empowers you to focus your efforts on critical paths and make informed decisions to reduce latency, leading to better overall application performance.
2. Precise Debugging and Issue Resolution
In the world of distributed systems, debugging and diagnosing issues can be like searching for a needle in a haystack. Jaeger’s ability to capture the complete journey of a request provides invaluable context when issues arise. If a user reports an error or unexpected behavior, you can trace the request’s path through various services and identify the exact service, operation, or component where the problem occurred. This granularity greatly accelerates the debugging process, enabling faster resolution of issues and a more seamless user experience.
3. Dependency Analysis and Impact Assessment
Modern applications often consist of numerous interconnected services. When you make changes to one service, it’s essential to understand how those changes might impact other parts of the system. Jaeger’s distributed tracing helps you visualize the dependencies between services and how they interact. This visibility allows you to assess the potential impact of changes before they are deployed. By understanding the ripple effects of modifications, you can minimize the risk of introducing unintended consequences or breaking other parts of the system.
4. Holistic Performance Monitoring
Traditional monitoring solutions provide aggregated metrics and insights into the overall health of your application. However, they might lack the depth required to understand how individual transactions and requests behave across multiple services. Jaeger complements these monitoring tools by offering a more granular view. It allows you to dive into the specifics of each request’s path, providing a deeper understanding of the system’s behavior, including how different components contribute to latency, errors, and performance variations.
5. Root Cause Analysis
When incidents occur, quickly identifying the root cause is essential to minimize downtime and prevent recurrence. Jaeger’s ability to visualize trace data helps you trace the sequence of events leading up to an incident. This not only helps you pinpoint the specific service or operation responsible but also provides insights into the sequence of events that led to the issue. This depth of analysis aids in addressing the root cause more effectively and implementing preventive measures to mitigate future occurrences.
6. User-Centric Performance Optimization
Ultimately, the success of your applications hinges on user experiences. Slow responses and errors can lead to frustrated users and abandonment. Jaeger’s distributed tracing enables you to focus on optimizing the user-centric aspects of your microservices architecture. By understanding how user requests traverse through various services, you can ensure that the critical paths—those directly impacting user interactions—are optimized for speed and reliability.
7. Continuous Improvement
Distributed tracing not only helps you identify and resolve issues but also facilitates continuous improvement. By regularly analyzing trace data, you can identify trends, patterns, and recurring bottlenecks. This data-driven approach allows you to make informed decisions about architectural changes, resource allocation, and performance optimization strategies. Continuous monitoring and analysis ensure that your microservices ecosystem evolves in alignment with changing user demands and application requirements.
In Conclusion
Distributed tracing with Jaeger offers a powerful way to gain insights into the behavior of your microservices architecture. By visualizing the path of requests and understanding how different services contribute to latency and errors, you can optimize performance and enhance the reliability of your applications. As you embark on your journey of exploring distributed tracing, Jaeger serves as a valuable tool to navigate the complexities of modern distributed systems.