


Introduction
Hello everyone, my name is Nguyen Le. I’m the QC Test Lead of NashTech. I would like to share the way I’m using Developer Tools for Web Application Testing.
Hello everyone, my name is Nguyen Le. I’m the QC Test Lead of NashTech. I would like to share the way I’m using Developer Tools for Web Application Testing. Browser Developer Tools does not mean they are not only usable by Developers but also used by Tester in testing effectively. Also, each browser has its developer tools. In this blog, I would like to introduce Chrome Developer Tools in Web Application Testing.
Chrome Developer Tools
Chrome Developer Tools (DevTools) is a set of web developer tools built directly into the Google Chrome browser. You can use DevTools to support testing in many testing types: API Testing, UI Testing, Accessibility Testing, Web Responsive Testing.
Open Developer Tools
There are a few ways to open Developer Tools.
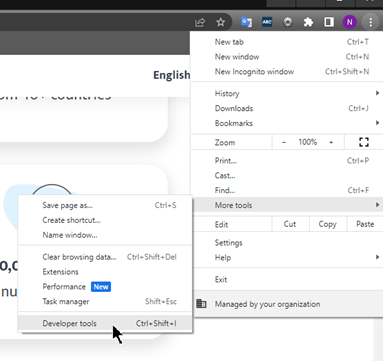
Chrom menu
- Open “more tools” menu in Chrome.
- Select Developer tools.
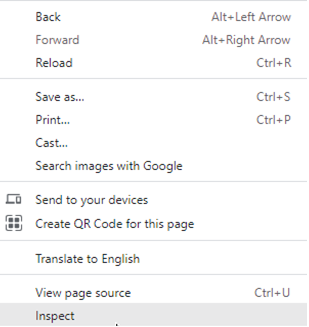
Inspect Element
- Click the right mouse button.
- Select Inspect.
Shortcuts
- Open Element panel: Ctrl + Shift + C (Windows/Linux), Cmd + Option + C (MacOS)
- Open Console panel: Ctrl + Shift + J (Windows/Linux), Cmd + Option + J (MacOS)
- Open last panel: F12 or Ctrl + Shift + I (Windows/Linux), Fn + F12 or Cmd + Option + I (MacOS)
Element Tab DOM view
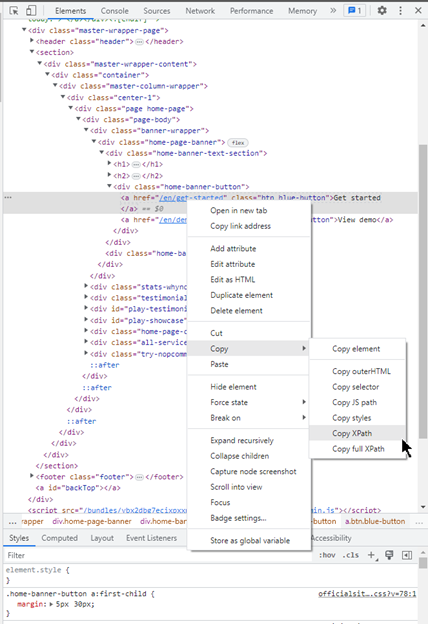
Find element locators for Automation Testing
This tab allows you to inspect information about web elements, you can view DOM. It will help to find a web locator and is very helpful for automation testing.
You can obtain the XPath or the CSS selector of an element from the DevTools, by right-clicking the element in the Elements tab and selecting Copy -> Copy XPath or Copy -> Copy Selector. You can also use the search function (Ctrl+F) to look for specific elements in the DOM.
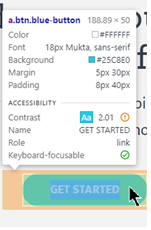
CSS Styling
You can check font size, font family, pixel size, and color code for UI testing.
- Open Element Tab.
- Select an element to inspect.
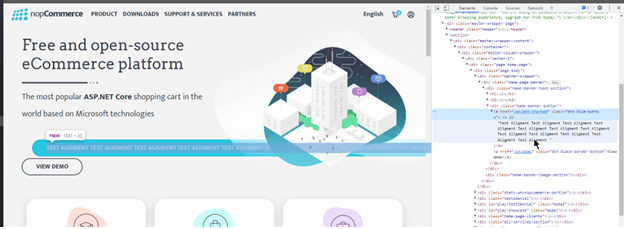
Can modify length of the to check alignment of website.
- Inspect an element, and modify the text.
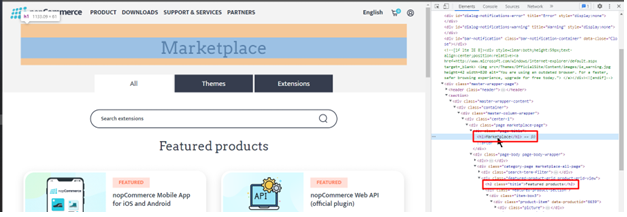
Check heading level for Accessibility Testing
- Inspect an element.
- Find heading level.
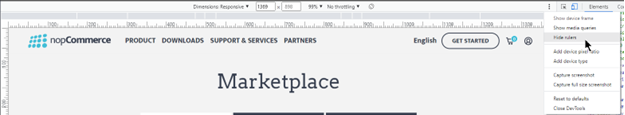
Web responsive design and device simulator
Web responsive design test
You can use the device toolbar to perform web responsive design tests.
For responsive design tests, you can change screen size by entering the expected dimensions and verifying display of web application.
- Enter dimensions (width and height) for a particular screen size.
- Open ruler for measurement.
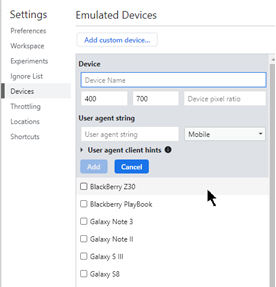
Device Simulator
Not as good as testing on a real device. While it will not simulate normal mobile functioning conditions, you can test the application’s look and feel on various displays.
- Select existing devices in the list for mobile devices.
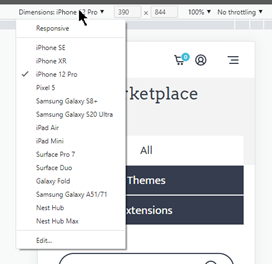
- Or add a new device with a custom configuration.
Network Tab
Monitoring HTTP requests from the Network tab
The Network tab shows information about all HTTP calls. Here, you can see the headers, the request body, the response code, and body, and even the response time. You can inspect them to test that the client sends the correct calls, and the server returns the correct response. The request URL and body can be even copied to be used for later API testing, using tools such as Postman.
- Open the network tab.
- Record network log.
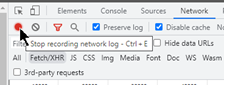
- Load web page and check log.
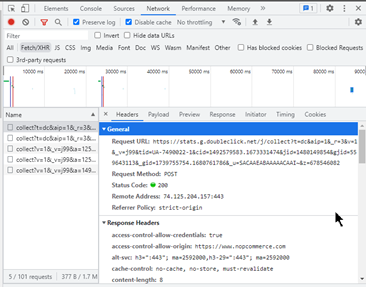
You can click on each request to see its details:
- Request URL
- Response and request header
- Request and response body
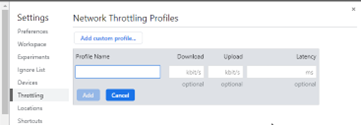
Simulate slower network connection
The network connection of mobile device is not as stable as network connection on computers. By using throttling, you can simulate a slow network connection on the mobile device.
- Open Network tab
- Open Throttling menu
- Select desired profile.
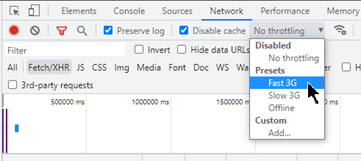
- Or add a custom profile.
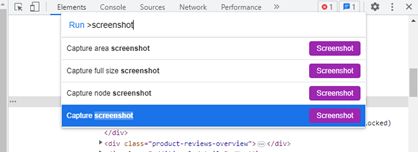
Capture screenshot
Developer Tools can capture screenshots of the website. If you press Ctrl+Shitft+P inside the DevTools, and enter “screenshot”, you will get 4 options
- Capture area screenshot – allows you to select which area of the page to save (like Windows Snipping Tools)
- Capture full size screenshot – will create an image copy of the entire page, including the parts that are not in view
- Capture node screenshot – creates a screenshot of the highlighted element, in the Elements tab
- Capture screenshot – will capture a screenshot of the part of the page that is currently in view.
All these options will download a .png file with the screenshot
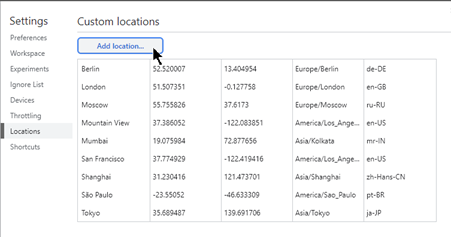
Simulate location
Suppose your web application needs to track your location and you want to test whether the tracking location function is working correctly with different locations, you can use DevTools to simulate the location.
- Open Sensor tab
- Select a city
- Reload website page or trigger the tracking location function
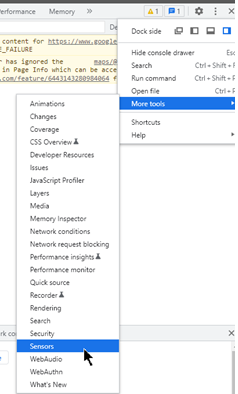
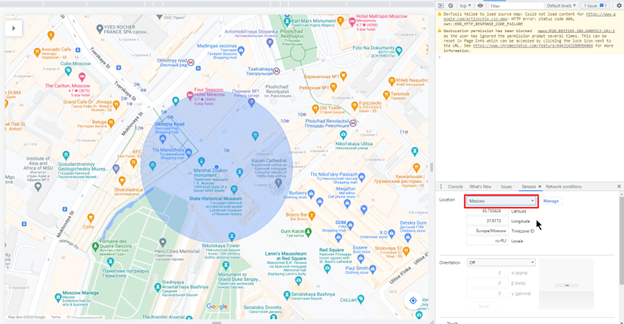
- You can add a new location with specific values: Latitude, Longitude, and Time zone.
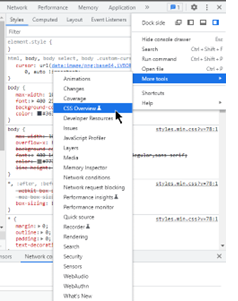
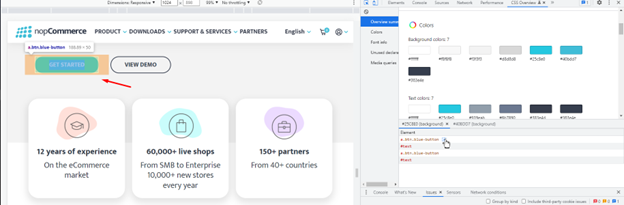
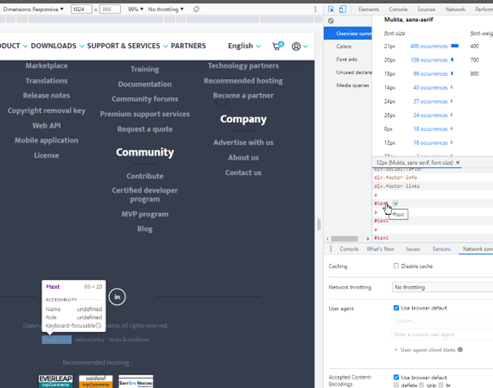
CSS Overview
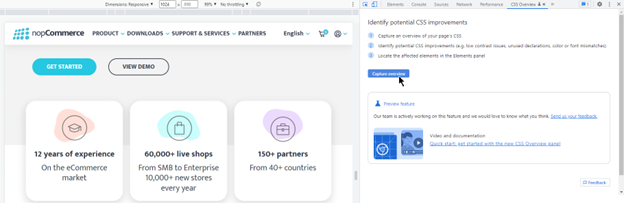
This is one of the new tools in DevTools. It captures the overview of CSS in website page, locates the affected element. You can go direct to the element in Element Panel. This will be helpful in UI Testing (check CSS color, font size, font family…)
- Open CSS Overview tab.
- Click “Capture Overview” button.
- Check Overview Summary
- Click on a color that you want to find an element.
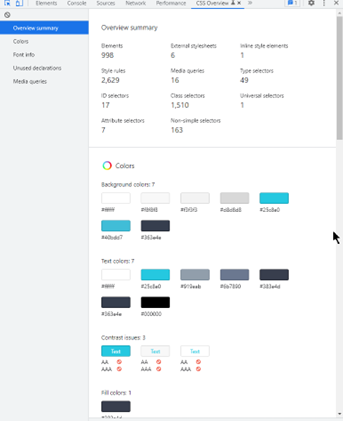
- Click on the element and the button will be highlighted on the website page.
- Repeat the same step to check font family, font size.
Audit Accessibility and generate test reports with Lighthouse
You can use Lighthouse to audit accessibility and generate test reports. This is what Lighthouse tool can help you determine:
- Whether a page is properly marked up for screen readers.
- The text elements on a page have sufficient contrast ratios.
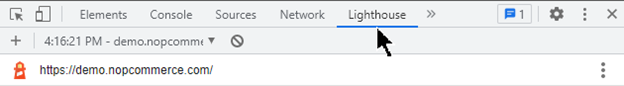
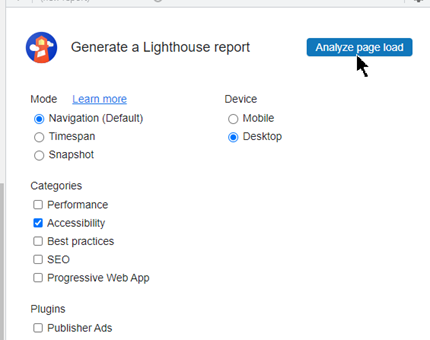
How to audit a web page
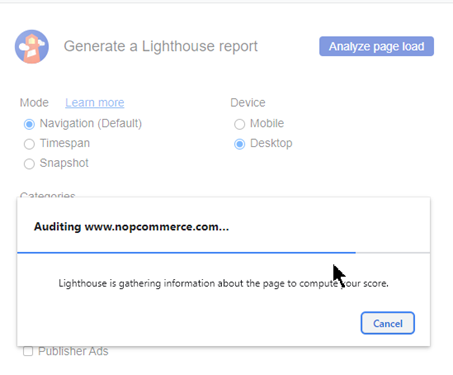
- Open Lighthouse tab
- Enable “Accessibility” in categories
- Click “Analyze page load” button
- Wait 10 – 20 seconds for generating report
How to analyze a report
- Report shows the overall score for Accessibility of website page.
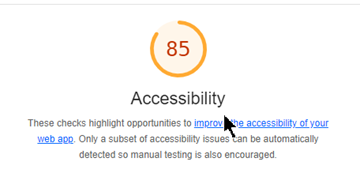
- Give tips on how to improve Accessibility.
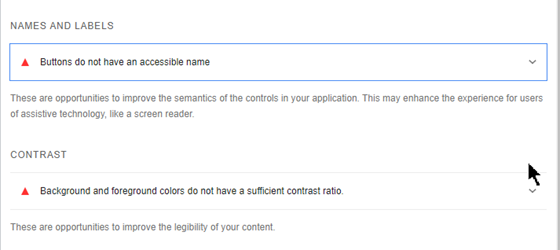
- Click on an item to learn more about it
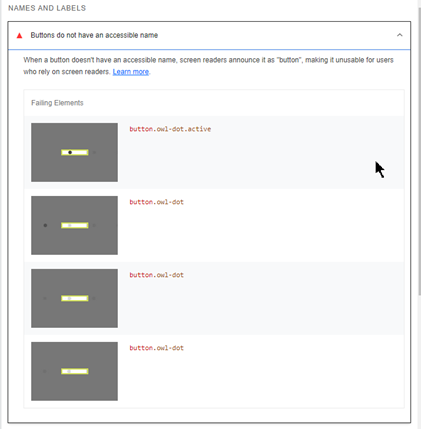
- Click the Learn more link to view the documentation of the issue.
Conclusion
Web testing can be very complex, and even if you only perform manual testing, you can still use various tools to help you. A very useful tool is the Developer Tools from Google Chrome.
Developer Tools contains many tools that are very helpful for web application testing. This blog covers some tools I can use as testers with what’s provided by default by Google, without installing extensions or other third-party apps.