


Website performance is a key factor in digital success, influencing user satisfaction, SEO, and conversions. In an era where every second counts, optimizing load times and responsiveness is critical. Google’s PageSpeed Insights offers a powerful, free solution to analyze and enhance your site’s speed across devices.
1. What is PageSpeed Insights?
Google PageSpeed Insights (PSI) is a free web-based tool provided by Google that analyzes the content of a web page and generates a report on its performance on both mobile and desktop devices. It provides actionable recommendations to improve the page’s loading speed, responsiveness, and overall user experience.
2. Why Monitor Website Performance?
Website speed is paramount for online success, directly influencing user experience, search engine rankings, and conversion rates. In an era of instant gratification, slow-loading websites lead to user frustration, high bounce rates, and a negative perception of your brand.
3. Key Metrics in PageSpeed Insights
At the heart of PSI’s analysis are the Core Web Vitals, a set of specific factors that Google considers crucial for overall user experience.
3.1 Largest Contentful Paint (LCP) – Measures Loading Performance
- Definition: LCP reports the time it takes for the largest visible content element (such as an image or block of text) to load within the user’s viewport.
- Goal: A fast LCP ensures users can see the main content quickly, ideally within 2.5 seconds.
3.2 Interaction to Next Paint (INP) – Measures Responsiveness
- Definition: INP evaluates the delay between a user’s interaction (like clicking a button or tapping a link) and the time the browser visually responds to that action.
- Goal: A low INP value (below 200 milliseconds) helps create a smooth, responsive user experience.
3.3 Cumulative Layout Shift (CLS) – Measures Visual Stability
- Definition: CLS quantifies how much the page layout shifts unexpectedly during the page’s lifetime. For example, when content jumps around as ads or images load.
- Goal: To ensure users don’t accidentally click the wrong thing due to layout movements.
3.4 First Contentful Paint (FCP) – Measures Initial Load Speed
- Definition: FCP marks the time when the first text or image is painted on the screen, indicating that the page is starting to load.
- Goal: A quick visual response within 1.8 seconds helps reassure users that the site is working.
3.5 Time to First Byte (TTFB – Experimental) – Measures Server Responsiveness
- Definition: TTFB measures how long it takes for the browser to receive the first byte of data from the server after a request is made.
- Goal: TTFB reflects backend speed and network latency and should be under 800 milliseconds.
4. Real-User Experience Data
PageSpeed Insights (PSI) doesn’t just rely on lab data—it also provides field data from actual users via the Chrome User Experience Report (CrUX). This data includes:
Real browsing experiences over the last 28 days
Insights across various devices and network conditions
As a result, PSI offers a realistic view of how your site performs in the hands of real users, not just in test environments.
PSI sets the following thresholds in alignment with the Web Vitals initiative:
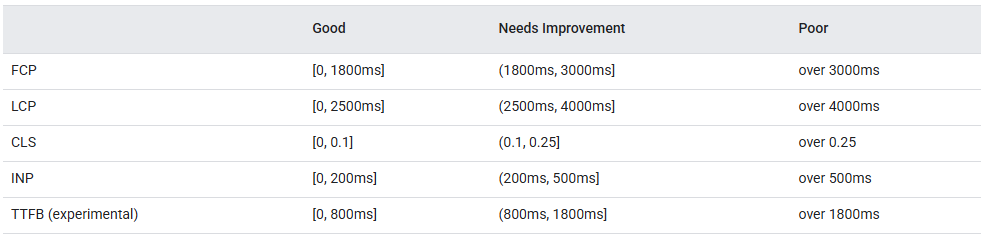
Real-user experience data in PSI is powered by the Chrome User Experience Report (CrUX) dataset. PSI reports real users’ First Contentful Paint (FCP), Interaction to Next Paint (INP), Largest Contentful Paint (LCP), and Cumulative Layout Shift (CLS) experiences over the previous 28-day collection period. PSI also reports experiences for the experimental metric Time to First Byte (TTFB).
5. How to Use PageSpeed Insights – Step-by-Step Guide
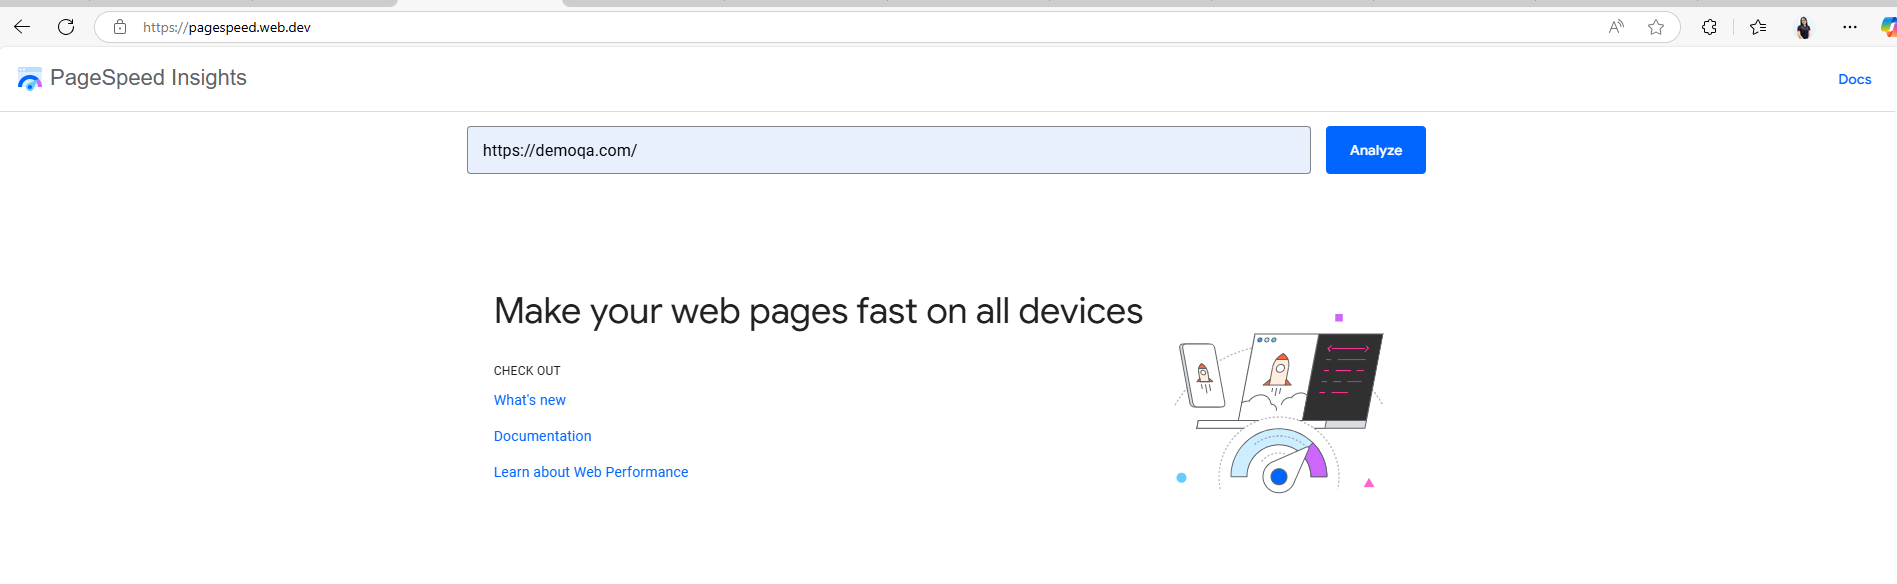
1. Go to PageSpeed Insights:
- Open
https://pagespeed.web.dev/in your browser.
2. Enter Your URL:
- In the input field, type or paste the URL you want to analyze. Example:
https://demoqa.com/ - Click the “Analyze” button.
3. Review the Report:
- Mobile vs. Desktop: Toggle between these tabs at the top, as performance often differs.
- Performance Score: See your 0-100 score (90-100 is “Good”).
- Core Web Vitals: Check the “Passed” or “Failed” status for LCP, INP, and CLS. This is crucial for real-world user experience and SEO.
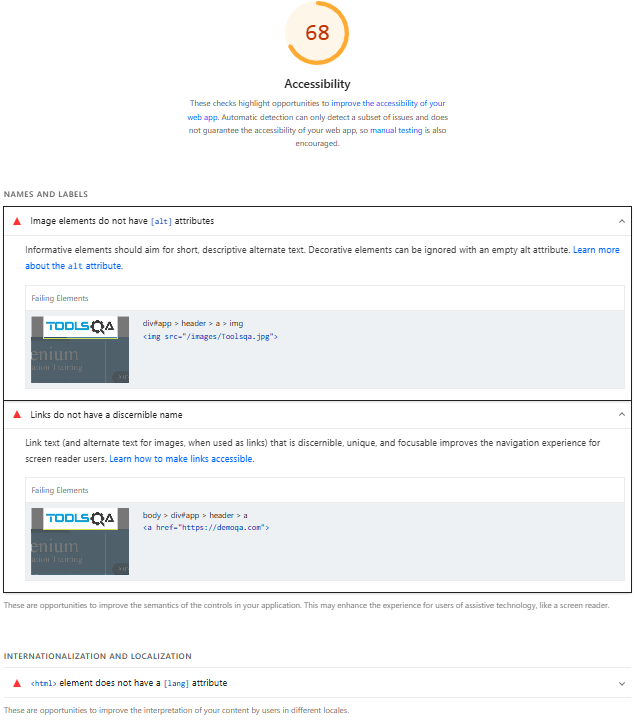
demoqa.comExample: You’ll likely see “Passed” for Core Web Vitals, but the overall score might be in the “Needs Improvement” range, especially for mobile (e.g., 60s-70s).

- Field Data (Real Users): “Discover what your real users are experiencing” shows actual performance data from Chrome users (CrUX report). Prioritize this section for understanding true user experience.
- Lab Data (Simulated): “Diagnose performance issues” provides detailed metrics (FCP, LCP, INP, CLS, TBT, Speed Index) from a controlled Lighthouse test. This helps identify specific bottlenecks.
- Opportunities: These are your actionable recommendations. Each item indicates potential time savings.
- Common Examples: “Serve images in next-gen formats,” “Eliminate render-blocking resources,” “Reduce initial server response time.”
- Click to expand each for detailed explanations and links to solutions.
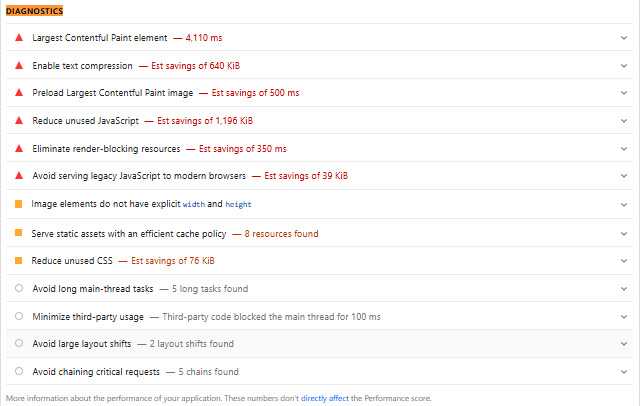
- Diagnostics: More technical details on web best practices.
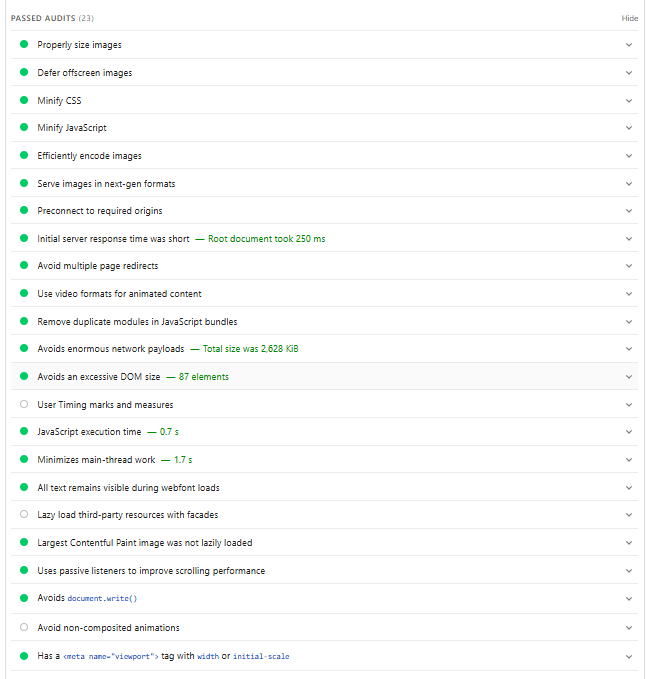
- Passed Audits: Confirms areas where your site is already optimized.
4. Act & Re-test:
- Prioritize: Focus on “Opportunities” with the biggest impact, especially those affecting Core Web Vitals.
- Implement: Apply the recommended fixes (e.g., optimize images, minify code, improve server response).
- Re-analyze: Run the test again after making changes to see your score improve.
By following these steps, you can effectively leverage PageSpeed Insights to enhance your website’s performance, leading to a better experience for your users and improved search engine visibility.
6. Tips for Improving PageSpeed Scores
6.1 Optimize Images
- Why: Large, unoptimized images are a common culprit for slow loading.
- How to fix:
- Compress: Use tools like TinyPNG or ImageOptim.
- Resize: Match image dimensions to display size (e.g., if an image displays at 300px wide, upload it at that size, not 2000px).
- Modern Formats: Convert to WebP (offers better compression than JPEG/PNG).
- Lazy Load: Load images only when they enter the user’s viewport (many CMS plugins offer this).
- Demo: Instead of
<img src="large-image.jpg" width="2000" height="1500">, use<img src="optimized-image.webp" width="300" height="225" loading="lazy">.
6.2 Minify CSS & JavaScript
- Why: Unnecessary characters (whitespace, comments) in code increase file size.
- How to fix: Remove all non-essential characters from your CSS and JavaScript files.
- Demo:
- Before:
CSS
/* Main styles */
body {
  margin: 0; /* No margin */
  padding: 0;
} - After:
CSS
body{margin:0;padding:0} - Many CMS themes/plugins or build tools (e.g., Webpack, Gulp) automate this.
- Before:
- Demo:
6.3 Eliminate Render-Blocking Resources
- Why: JavaScript and CSS files in the
<head>of your HTML can stop the page from rendering until they’re fully loaded. - How to fix:
- Async/Defer JS: Add
asyncordeferattributes to<script>tags to allow parsing of the HTML to continue. - Critical CSS: Inline small, essential CSS directly into the HTML to render initial content immediately. Load the rest asynchronously.
- Demo:
- Before:
<script src="heavy-script.js"></script> - After (preferred):
http://heavy-script.js - Or:
http://heavy-script.js
- Before:
- Async/Defer JS: Add
6.4 Reduce Server Response Time (TTFB)
- Why: The time it takes for your server to respond with the first byte of data significantly impacts load time.
- How to fix:
- Quality Hosting: Invest in reliable, fast web hosting.
- CDN: Use a Content Delivery Network to serve content from servers geographically closer to users.
- Caching: Implement server-side caching (e.g., Redis, Varnish) and database optimization.
- Demo: This is server-side and depends on your hosting and backend setup. No direct code demo, but selecting a good host like Kinsta or WP Engine is a practical step.
6.5 Leverage Browser Caching
- Why: Allows returning visitors’ browsers to store static assets (images, CSS, JS) locally, avoiding re-downloading.
- How to fix: Configure HTTP caching headers (e.g.,
Cache-Control,Expires) on your server. - Demo (via
.htaccessfor Apache):Apache
<IfModule mod_expires.c>
  ExpiresActive On
  ExpiresByType image/jpg "access 1 year"
  ExpiresByType text/css "access 1 month"
</IfModule>
7. Pros & Cons
7.1 Pros
- Google’s View: Directly aligns with Google’s SEO and ranking factors, especially Core Web Vitals.
- Real User Data: Unique access to actual user experience data (CrUX)
- Free & Easy: Simple to use, no cost, direct actionable advice.
- Mobile-First: Dedicated mobile and desktop reports.
7.2 Cons
- Lab Data Limitations: Simulated data might not capture all real-world complexities.
- Limited Customization: Fewer options for specific test locations or network throttling.
- Score Misinterpretation: The numerical score needs deeper metric analysis to be fully understood.
- Code-Centric: Recommendations are often technical, requiring developer input.
7.3 Comparison
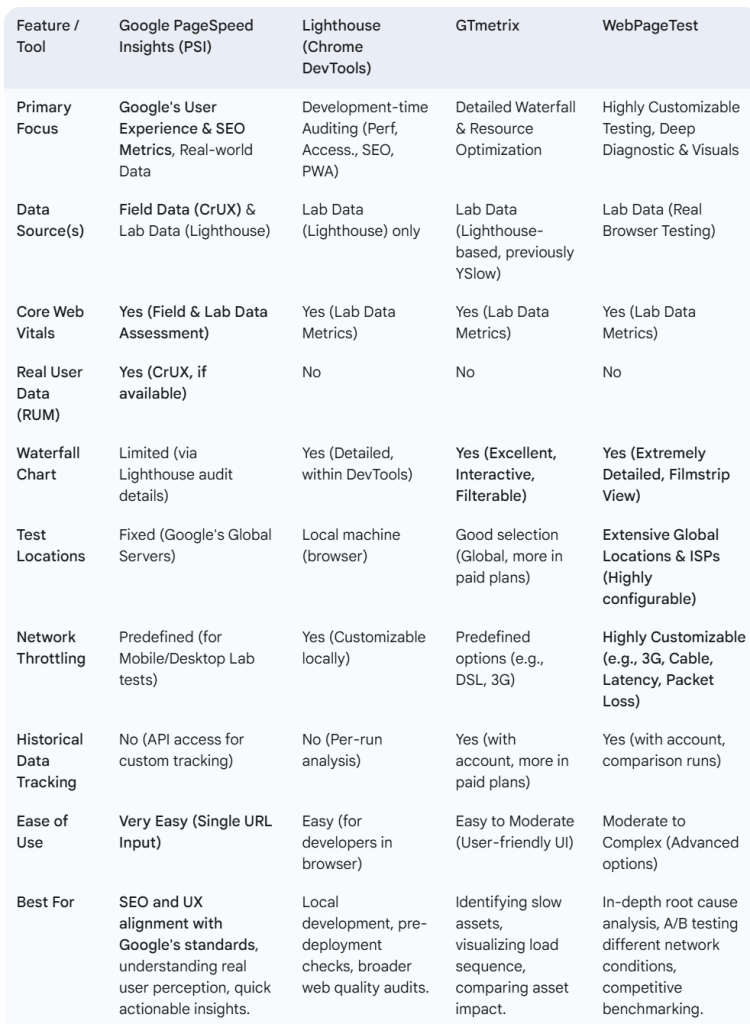
Conclusion
To sum it up, Google PageSpeed Insights simplifies website optimization, offering a clear path to a faster, more effective online presence. It equips you with the essential insights to elevate user satisfaction, climb search rankings, and achieve your business goals. Harness its power – a faster site is a more successful site.
Reference: