


Introduction
With the industry moving towards cloud-native approach, maintaining robust observability and monitoring is crucial for ensuring high performance and reliability. Integrating Datadog with OpenTelemetry in a .NET application provides a powerful combination for comprehensive monitoring and tracing. This blog post will guide you through the process of setting up telemetry, configuring Datadog, and leveraging its advanced monitoring features. Whether you’re aiming to improve performance, detect anomalies, or gain deeper insights into your application’s behavior, this integration will equip you with the tools needed for effective observability and proactive issue resolution.
This blog post builds on top of my previous posts on this topic:
- Adding OpenTelemetry Support to Asp.Net and Azure Function App
- Adding Custom Metrics to .Net Application
We are going to leverage OpenTelemetry exporter that we added previously instead of adding any vendor specific library.
Prerequisites
- Docker and Docker Compose
- Basic understanding of OpenTelemetry
Setting up .Net Application
- Since we are using Aspire scafolded project, we have ServiceDefaults project, inside that we have Extension.cs file. Create a new DiagnosticsConfig class inside it like following:
public static class DiagnosticsConfig
{
  public const string ServiceName = "opentelemetry-demo";
  public static ActivitySource ActivitySource = new ActivitySource(ServiceName);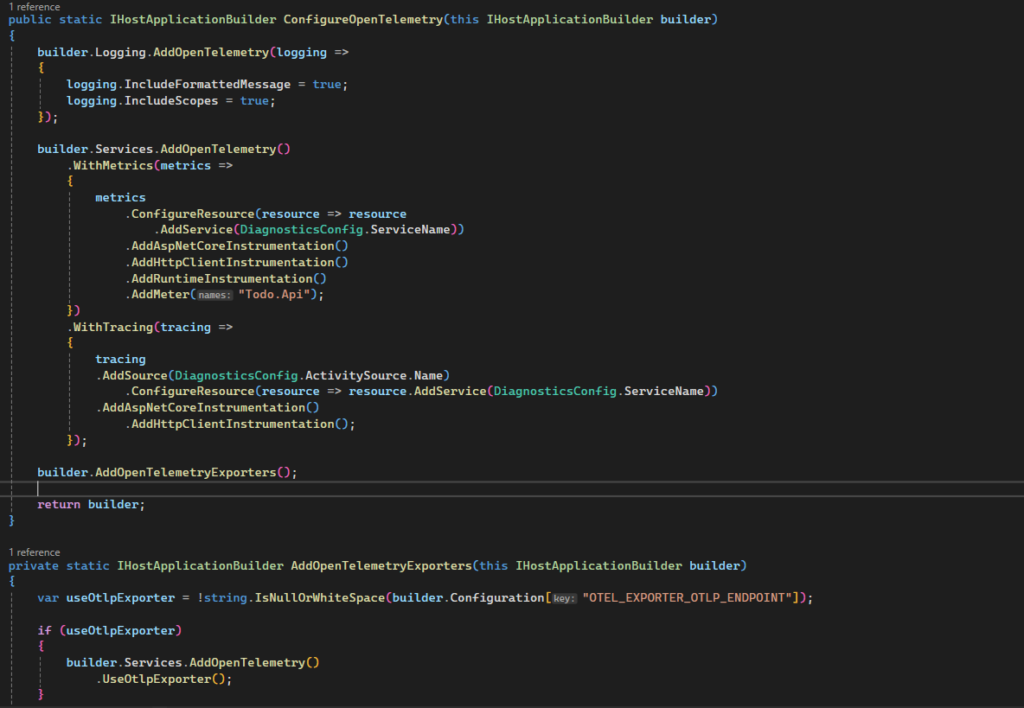
}- Next,configure OpenTelemetryBuilder as following:
builder.Services.AddOpenTelemetry()
.WithMetrics(metrics =>
{
  metrics
    .ConfigureResource(resource => resource
      .AddService(DiagnosticsConfig.ServiceName))
    .AddAspNetCoreInstrumentation()
    .AddHttpClientInstrumentation()
    .AddRuntimeInstrumentation()
    .AddMeter("Todo.Api");
})
.WithTracing(tracing =>
{
  tracing
    .AddSource(DiagnosticsConfig.ActivitySource.Name)
      .ConfigureResource(resource => resource.AddService(DiagnosticsConfig.ServiceName))
    .AddAspNetCoreInstrumentation()
    .AddHttpClientInstrumentation();
});- Make sure you have added following line of code:
builder.Services.AddOpenTelemetry()
                            .UseOtlpExporter();
With this setup, our final code will look something like following:
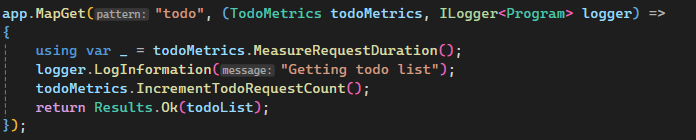
- We have defined our API endpoint as following:
Setting up Datadog
- Go ahead and sign-up for Datadog. You don’t need to setup any agent locally on your machine as we are going to use docker for that. Once you are logged in, Goto Dashboard -> Hover on profile -> API Keys
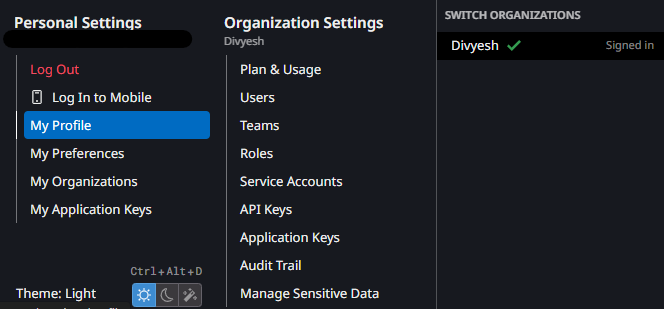
- Click on New Key and give a name to it -> Create Key. You will see the API Key, copy this for now, we will use this later on.
Setting up Docker
- Create a DockerFile for your application like following:
FROM mcr.microsoft.com/dotnet/aspnet:8.0 AS base
USER app
WORKDIR /app
EXPOSE 5078

# This stage is used to build the service project
FROM mcr.microsoft.com/dotnet/sdk:8.0 AS build
ARG BUILD_CONFIGURATION=Release
WORKDIR /src
COPY ["OpenTelemetryDemo.Api/OpenTelemetryDemo.Api.csproj", "OpenTelemetryDemo.Api/"]
COPY ["OpenTelemetryDemo.ServiceDefaults/OpenTelemetryDemo.ServiceDefaults.csproj", "OpenTelemetryDemo.ServiceDefaults/"]
RUN dotnet restore "./OpenTelemetryDemo.Api/OpenTelemetryDemo.Api.csproj"
COPY . .
WORKDIR "/src/OpenTelemetryDemo.Api"
RUN dotnet build "./OpenTelemetryDemo.Api.csproj" -c $BUILD_CONFIGURATION -o /app/build

# This stage is used to publish the service project to be copied to the final stage
FROM build AS publish
ARG BUILD_CONFIGURATION=Release
RUN dotnet publish "./OpenTelemetryDemo.Api.csproj" -c $BUILD_CONFIGURATION -o /app/publish /p:UseAppHost=false

# This stage is used in production or when running from VS in regular mode (Default when not using the Debug configuration)
FROM base AS final
WORKDIR /app
COPY --from=publish /app/publish .
ENTRYPOINT ["dotnet", "OpenTelemetryDemo.Api.dll"]
For the purpose of this blog post, we are not going to focus on dockerizing .Net application but rather just setting it up for OpenTelemetry
- Create a docker-compose.yaml file and add following code in it:
version: '3.9'
services:
  opentelemetry-demo-api:
    depends_on:
      - datadog-agent
    container_name: opentelemetry-demo-api
    build:
      context: .
      dockerfile: Dockerfile
    environment:
      - OTEL_SERVICE_NAME=opentelemetry-demo
      - 'OTEL_EXPORTER_OTLP_ENDPOINT=http://datadog-agent:4317'
      - OTEL_EXPORTER_OTLP_PROTOCOL=grpc
      - 'OTEL_RESOURCE_ATTRIBUTES=deployment.environment=demo,host.name=otel-demo'
      - 'ASPNETCORE_URLS=http://+:5078'
    ports:
      - '5078:5078'
  datadog-agent:
    container_name: datadog-agent
    image: 'gcr.io/datadoghq/agent:latest'
    pid: host
    ports:
      - '8126:8126'
      - '4317:4317'
      - '4318:4318'
    environment:
      - DD_API_KEY=## Add your API Key Here!! ##
      - DD_SITE=us5.datadoghq.com
      - DD_APM_NON_LOCAL_TRAFFIC=true
      - 'DD_OTLP_CONFIG_RECEIVER_PROTOCOLS_GRPC_ENDPOINT=0.0.0.0:4317'
      - 'DD_OTLP_CONFIG_RECEIVER_PROTOCOLS_HTTP_ENDPOINT=0.0.0.0:4318'
    volumes:
      - '/var/run/docker.sock:/var/run/docker.sock'
      - '/proc/:/host/proc/:ro'
      - '/sys/fs/cgroup:/host/sys/fs/cgroup:ro'
Here, we are using docker compose to create 2 services: API & Datadog agent. We are also defining some environment variables in our api such as OTEL_EXPORTER_OTLP_ENDPOINT which will point to the datadog agent. Tip: You can also point it to locally installed docker agent outside of docker. We also define OTEL_SERVICE_NAME and OTEL_RESOURCE_ATTRIBUTES which will be populated in datadog portal (will see this later on)
Make sure, you are correctly passing the API key to DD_API_KEY that we grabbed earlier and DD_SITE according to your region.
Running Everything
Now comes the exciting part of running everything so far and see it in action. Fire up folllowing command on root path of the project
docker compose -f docker-compose.yaml upYou’ll see the project build and images being downloaded. Once, the containers are up and running as following:
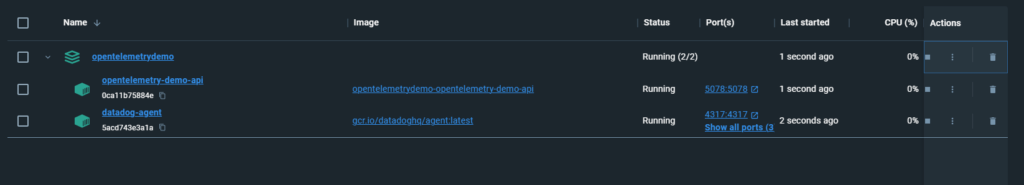
It’s time to visit one of the endpoint which in turn will generate some logs and metrics. Endpoint : http://localhost:5078/todo
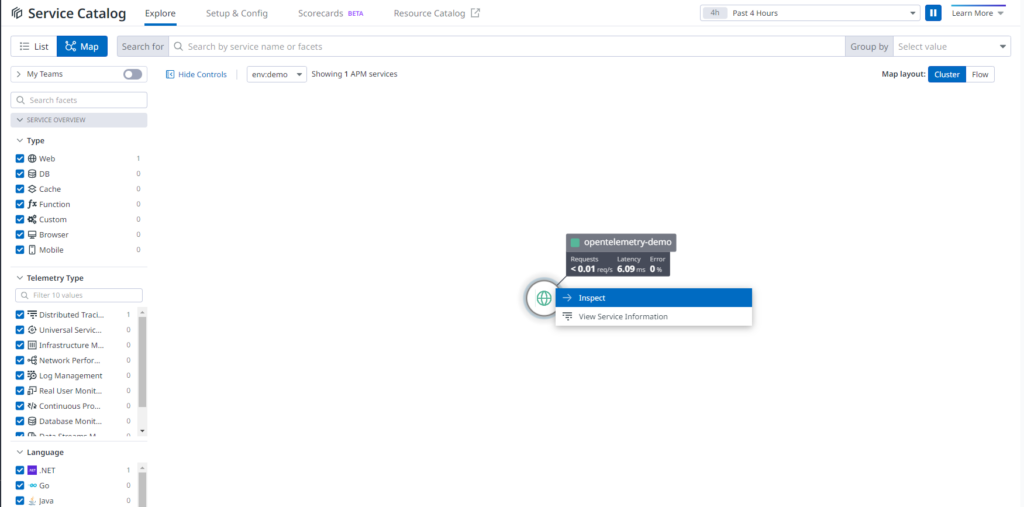
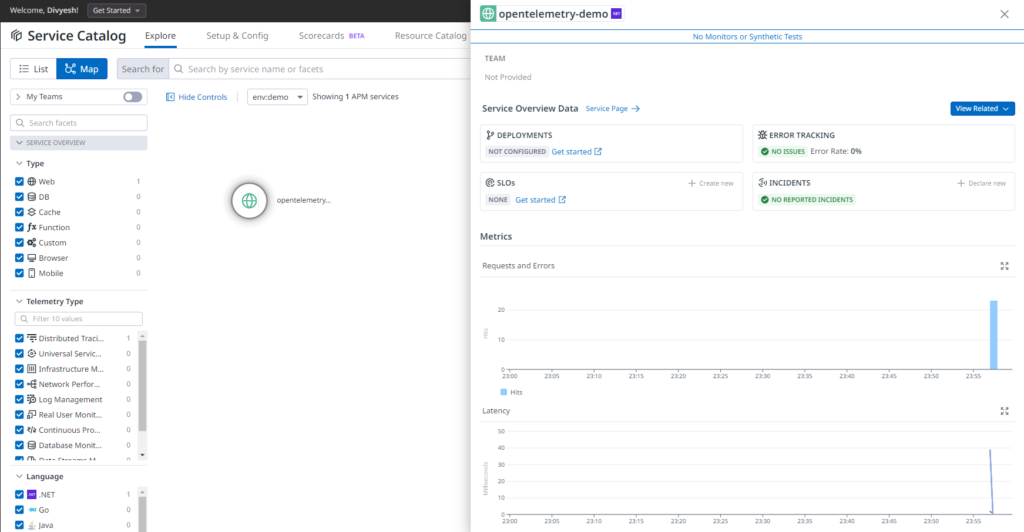
Go to Datadog dashboard -> APM -> Service Map. You’ll find our application being populated there. To see details, click on View Service Information
You can also view traces by going to APM -> Traces Explorer
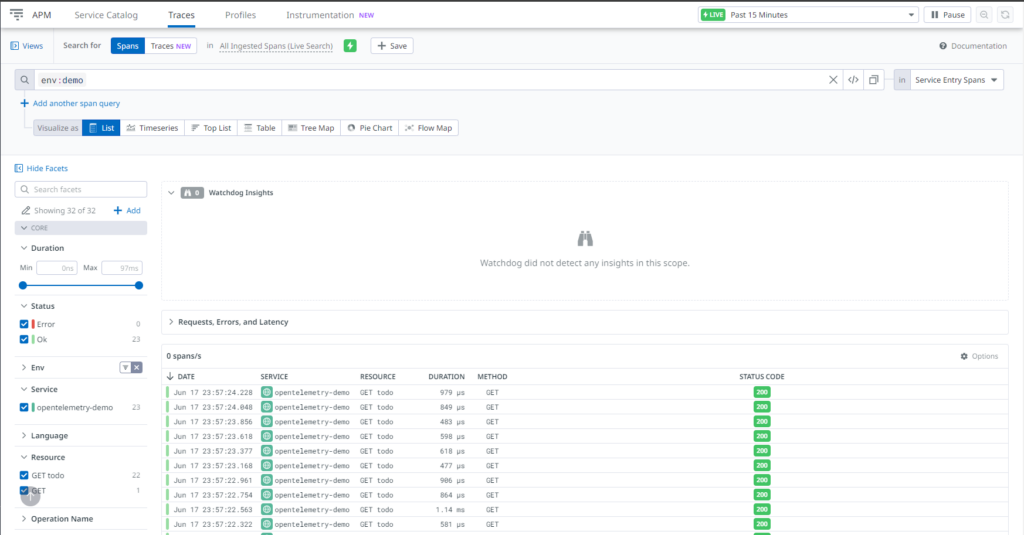
Similar to what we saw locally in Aspire Dashboard, everything will show up here as it based on OpenTelemetry standard.
Conclusion
Integrating Datadog with OpenTelemetry in your .NET application unlocks powerful capabilities for comprehensive monitoring and observability. By following the steps outlined in this guide, you can seamlessly set up telemetry, configure Datadog, and leverage its advanced features to gain deep insights into your application’s performance. This integration not only helps in proactively identifying and resolving issues but also enhances overall system reliability and user experience. With Datadog and OpenTelemetry working together, you are well-equipped to monitor, troubleshoot, and optimize your .NET applications effectively.