



In our previous blogs, we explored how Delta Lake can:
- Modernize insurance underwriting analytics
- Create unified risk profiles
- Reconstruct historical decisions using Time Travel
- Segment risks intelligently
- Process telematics at scale
- Enable real-time risk assessment
However, underwriting is only one side of the risk management equation. For Property & Casualty (P&C) insurers, understanding catastrophe exposure across an entire portfolio is equally critical. A single hurricane, wildfire, flood, or earthquake event can generate thousands of simultaneous claims across geographically concentrated policyholders. Consequently, insurers must continuously evaluate their exposure to catastrophic events, identify geographic concentrations of risk, and make informed underwriting and reinsurance decisions.
In this article, we examine how Delta Lake can become the foundation for large-scale catastrophe risk research and portfolio exposure analytics.
Why Catastrophe Exposure Analysis Matters?
Traditional underwriting evaluates individual policies. However, catastrophe risk management evaluates the collective impact of a major event on an entire portfolio. For instance,
- A hurricane approaching the Gulf Coast
- A wildfire spreading through California
- An earthquake affecting a major metropolitan region
An insurer may have:
- Tens or hundreds of thousands of active policies
- Multiple lines of business
- Billions of dollars in exposure
Understanding potential losses requires aggregating and analyzing enormous volumes of policy, property, geographic, and hazard data. Delta Lake provides a scalable platform for performing these analyses efficiently.
Building a Catastrophe Risk Lakehouse
A catastrophe research platform typically integrates data from several domains.
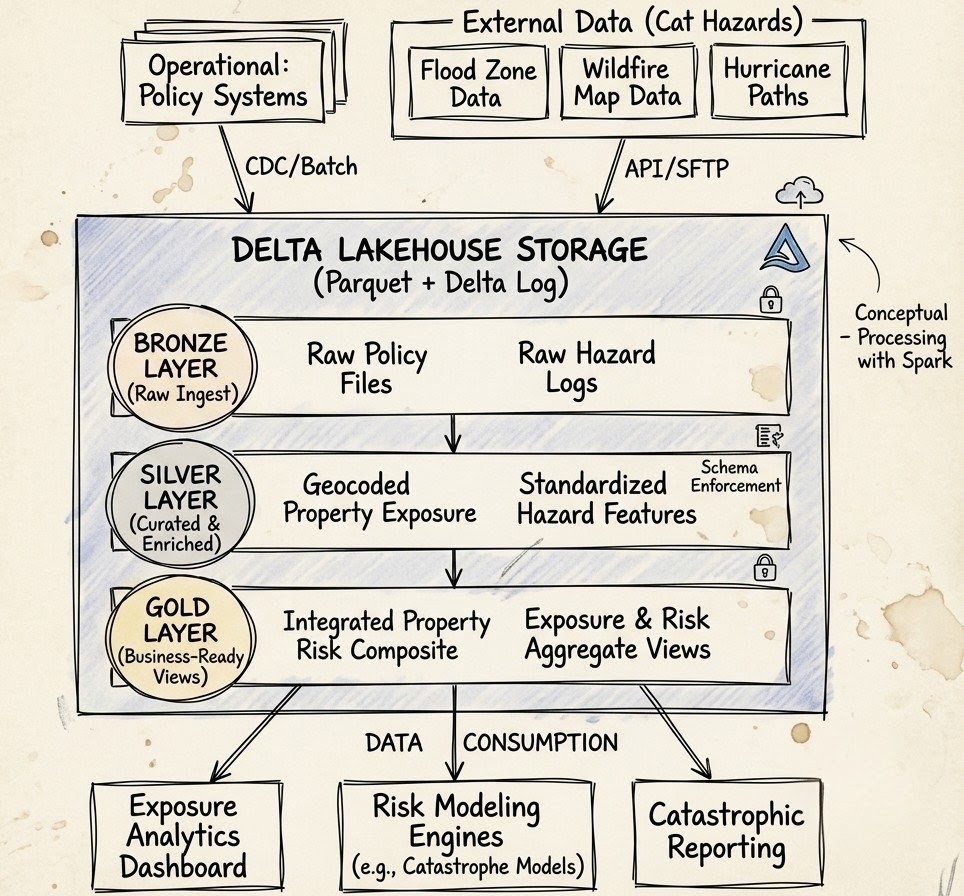
Policy Data
It can include fields like:
policy_id
insured_value
state
city
Hazard Data
It can include fields like:
hazard_id
hazard_type
risk_score
geographic_boundary
update_timestamp
Claims History
It can include fields like:
claim_id
loss_amount
event_type
settlement_status
Combining these datasets enables a sophisticated catastrophe exposure analysis.
Sample Exposure Dataset
Suppose we maintain insured property exposure data
exposures = [
    ("P001", "Florida", "Miami", 1200000),
    ("P002", "Florida", "Tampa", 850000),
    ("P003", "California", "Los Angeles", 950000),
    ("P004", "California", "San Diego", 740000),
    ("P005", "Texas", "Houston", 1300000)
]
Delta Table:
from pyspark.sql import SparkSession

spark = SparkSession.builder.getOrCreate()

df = spark.createDataFrame(
    exposures,
    ["policy_id", "state", "city", "insured_value"]
)

df.write.format("delta")
    .mode("overwrite")
.save("/delta/property_exposure")| policy_id | state | city | insured_value |
|---|---|---|---|
| P001 | Florida | Miami | 1,200,000 |
| P002 | Florida | Tampa | 850,000 |
| P003 | California | Los Angeles | 950,000 |
| P004 | California | San Diego | 740,000 |
| P005 | Texas | Houston | 1,300,000 |
Flood Exposure Analysis
Flood events continue to generate significant insured losses globally. Suppose flood zone information is available:
flood_zones = [
    ("Miami", "High"),
    ("Tampa", "Medium"),
    ("Houston", "High")
]

flood_df = spark.createDataFrame(
    flood_zones,
    ["city", "flood_risk"]
)
Joining insured properties with flood zones:
risk_df = df.join(
    flood_df,
    ["city"],
    "left"
)

risk_df.show()| city | policy_id | state | insured_value | flood_risk |
|---|---|---|---|---|
| Miami | P001 | Florida | 1200000 | High |
| Tampa | P002 | Florida | 850000 | Medium |
| Houston | P005 | Texas | 1300000 | High |
This allows catastrophe analysts to immediately quantify insured value located within flood-prone regions.
Wildfire Exposure Analysis
Wildfires increasingly threaten residential and commercial properties. Suppose a wildfire risk model generates risk scores:
wildfire_data = [
    ("Los Angeles", 88),
    ("San Diego", 76)
]

wildfire_df = spark.createDataFrame(
    wildfire_data,
    ["city", "wildfire_score"]
)
Exposure analytics:
wildfire_exposure = (
  df.join(wildfire_df, ["city"])
    .orderBy("wildfire_score", ascending=False)
)

wildfire_exposure.show()| city | policy_id | state | insured_value | wildfire_score |
|---|---|---|---|---|
| Los Angeles | P003 | California | 950000 | 88 |
| San Diego | P004 | California | 740000 | 76 |
Underwriters can identify concentration of insured value in wildfire-prone regions.
Hurricane Exposure Modeling
Hurricanes represent one of the largest accumulation risks for insurers. Assume hurricane exposure zones:
hurricane_zones = [
    ("Florida", "Severe"),
    ("Texas", "High")
]

zone_df = spark.createDataFrame(
    hurricane_zones,
    ["state", "hurricane_risk"]
)
Aggregation of total insured value:
hurricane_exposure = (
    df.join(zone_df, ["state"])
    .groupBy(
        "state",
        "hurricane_risk"
    )
    .sum("insured_value")
)

hurricane_exposure.show()| state | hurricane_risk | sum(insured_value) |
|---|---|---|
| Florida | Severe | 2050000 |
| Texas | High | 1300000 |
These figures are frequently used in catastrophe modeling and reinsurance planning.
Portfolio Aggregation Analytics
A key catastrophe research objective is understanding total exposure across an entire portfolio.
State-level aggregation:
portfolio_summary = (
  df.groupBy("state")
    .sum("insured_value")
    .orderBy(
        "sum(insured_value)",
        ascending=False
    )
)

portfolio_summary.show()| state | sum(insured_value) |
|---|---|
| Florida | 2050000 |
| Texas | 1300000 |
| California | 1690000 |
This provides immediate visibility into exposure accumulation.
Geographic Risk Concentration Analysis
One of the most common catastrophe analytics use cases is identifying concentration hotspots. For instance:
from pyspark.sql.functions import sum

city_exposure = (
  df.groupBy("city")
    .agg(
        sum("insured_value")
        .alias("total_exposure")
    )
    .orderBy(
        "total_exposure",
        ascending=False
    )
)

city_exposure.show()| city | total_exposure |
|---|---|
| Houston | 1300000 |
| Miami | 1200000 |
| Los Angeles | 950000 |
| Tampa | 850000 |
| San Diego | 740000 |
Risk managers can use these insights to:
- Adjust underwriting appetite
- Increase premium requirements
- Evaluate reinsurance coverage adequacy
Scaling to Billions of Exposure Records
As discussed in our previous article on processing billions of telematics events, Delta Lake offers several capabilities that are equally valuable for catastrophe research:
- ACID Transactions: Ensure consistent exposure calculations during concurrent updates.
- Schema Evolution: Accommodate new hazard models and external catastrophe datasets.
- Data Skipping: Reduce scan times when querying specific geographic regions.
- Partitioning: Optimize analytics by state, country, hazard type, year, etc.
- Change Data Feed: Track exposure changes over time and monitor portfolio growth in catastrophe-prone regions.
Bringing It All Together
A modern catastrophe risk platform built on Delta Lake can:
In-Summary
Catastrophe risk analysis is becoming increasingly data-intensive as insurers face more frequent and severe natural disasters. Traditional policy administration systems were never designed to support large-scale research across billions of exposure records, multiple hazard datasets, and evolving catastrophe models.
Delta Lake provides a robust foundation for modern catastrophe exposure analytics by combining scalable storage, reliable data management, historical versioning, and high-performance analytics. By unifying policy, hazard, claims, and geographic datasets into a single lakehouse architecture, insurers can gain deeper visibility into portfolio risk concentrations, improve underwriting decisions, and strengthen catastrophe preparedness.