


Introduction
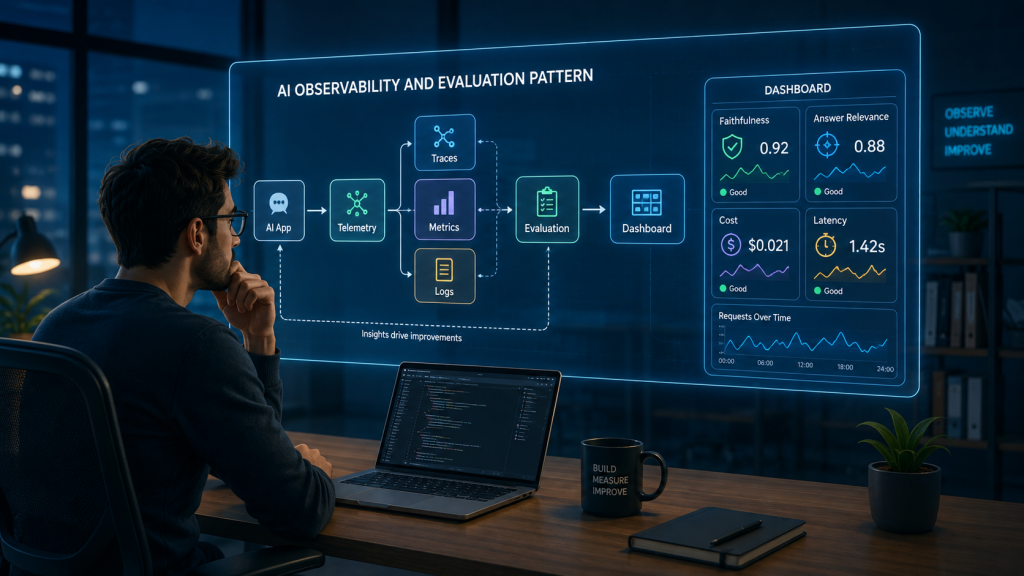
The AI Observability and Evaluation Pattern provides a structured approach for understanding how an AI system behaves after it has been deployed into production.
Traditional application monitoring helps engineering teams answer questions such as:
- Is the service available?
- How long does a request take?
- How many requests are failing?
- Is the application consuming too much CPU or memory?
These questions remain important for AI systems, but they are not sufficient.
An AI endpoint may return an HTTP 200 response within the expected latency while still producing inaccurate, irrelevant, biased, outdated, or unsupported results. A retrieval-augmented generation application may remain technically available while retrieving poor-quality documents. An AI agent may successfully complete a workflow while selecting the wrong tool or taking unnecessary steps.
The AI Observability and Evaluation Pattern extends conventional monitoring by combining operational telemetry with AI-specific quality evaluation.
It helps teams understand:
- What happened during an AI request
- Why a response was slow or expensive
- Which model and prompt version produced the result
- Whether the output was relevant and correct
- Whether a generated answer was grounded in trusted information
- Whether production input has changed over time
- Whether users accepted or rejected the result
- Whether a new model version performs better than the existing one
OpenTelemetry describes observability signals such as traces, metrics, logs, and baggage as complementary ways to understand the internal activity of a distributed system. For generative AI applications, emerging semantic conventions also provide structured telemetry for model calls, token usage, tool executions, and related operations.
This article explains how the pattern works, how it differs from traditional monitoring, which metrics should be collected, and how to implement a practical observability and evaluation platform for production AI systems.
What Is the AI Observability and Evaluation Pattern?
The AI Observability and Evaluation Pattern captures operational data and quality signals across the complete AI request lifecycle.
A simplified architecture looks like this:
User or Client
      |
      v
AI Application
      |
      +----------------------------+
      |                            |
      v                            v
Model, RAG or Agent          Telemetry Instrumentation
      |                            |
      v                            v
AI Response                 Logs, Metrics and Traces
      |                            |
      +-------------+--------------+
                    |
                    v
             Evaluation Engine
                    |
          +---------+----------+
          |                    |
          v                    v
    Quality Results      Monitoring Dashboard
          |                    |
          +---------+----------+
                    |
                    v
           Alerts and Improvement
The pattern consists of two related capabilities.
AI Observability
AI observability captures what happened while the system processed a request.
It focuses on signals such as:
- Request latency
- Model latency
- Retrieval latency
- Tool execution time
- Token consumption
- Infrastructure errors
- Model versions
- Prompt versions
- Retrieved documents
- Agent execution steps
- Cost
- User feedback
AI Evaluation
AI evaluation assesses whether the system produced a useful and acceptable result.
It focuses on questions such as:
- Was the answer correct?
- Was it relevant to the user’s request?
- Was it grounded in the provided context?
- Did the retriever return the right documents?
- Did the agent use the appropriate tools?
- Did the prediction match the eventual business outcome?
- Did the new release perform better than the previous version?
Observability explains how the system behaved.
Evaluation measures how well the system performed its intended task.
A production-ready AI platform normally requires both.
Why Traditional Monitoring Is Not Enough
Consider a customer support knowledge assistant.
A user asks:
What is the refund period for an annual subscription?
The application returns an answer in 1.2 seconds.
From a traditional monitoring perspective:
HTTP status: 200
Latency: 1.2 seconds
CPU usage: 42%
Memory usage: Normal
Error rate: 0%
The service appears healthy.
However, suppose the answer says:
Customers can request a refund within 60 days.
The current policy document states that refunds are available within 30 days.
The application is technically operational but functionally incorrect.
Traditional monitoring cannot necessarily detect this problem because:
- No exception occurred.
- The request completed within the expected latency.
- The infrastructure remained healthy.
- The output matched the required response schema.
AI systems introduce probabilistic behaviour. A successful service invocation does not guarantee a successful business result.
A complete monitoring approach must therefore examine several layers:
Infrastructure health
        |
Application reliability
        |
AI pipeline behaviour
        |
Output quality
        |
Business outcome
Each layer answers a different question.
| Layer | Main question |
|---|---|
| Infrastructure | Are computing resources available? |
| Application | Did the request complete successfully? |
| AI pipeline | Which components and models produced the result? |
| Quality | Was the result accurate, relevant and grounded? |
| Business | Did the result improve the intended outcome? |
Example Use Case: Observing a Knowledge Assistant
The demonstration for this article uses a simple enterprise knowledge assistant.
A user submits a question. The application:
- Creates an embedding for the question.
- Retrieves relevant document chunks.
- Constructs a prompt.
- Calls a language model.
- Returns an answer with references.
- Captures telemetry for the complete operation.
- Evaluates selected responses.
- Displays technical and quality metrics.
A simplified request might look like this:
POST /api/v1/questions
Content-Type: application/json
{
  "question": "How long can customers request a subscription refund?",
  "sessionId": "session-2048"
}
The response could be:
{
  "answer": "Customers may request a refund within 30 days of the initial subscription purchase.",
  "sources": [
    {
      "documentId": "refund-policy",
      "chunkId": "refund-policy-04"
    }
  ],
  "requestId": "req-7a28d4",
  "modelName": "knowledge-assistant",
  "modelVersion": "1.1.0",
  "promptVersion": "support-rag-v3",
  "latencyMs": 842,
  "inputTokens": 516,
  "outputTokens": 42
}
The observability system records the complete execution path.
The evaluation system may later produce:
{
  "requestId": "req-7a28d4",
  "answerRelevance": 0.94,
  "faithfulness": 1.0,
  "contextPrecision": 0.88,
  "userFeedback": "accepted"
}
The technical and quality signals are linked using the same request or trace identifier.
Reference Architecture
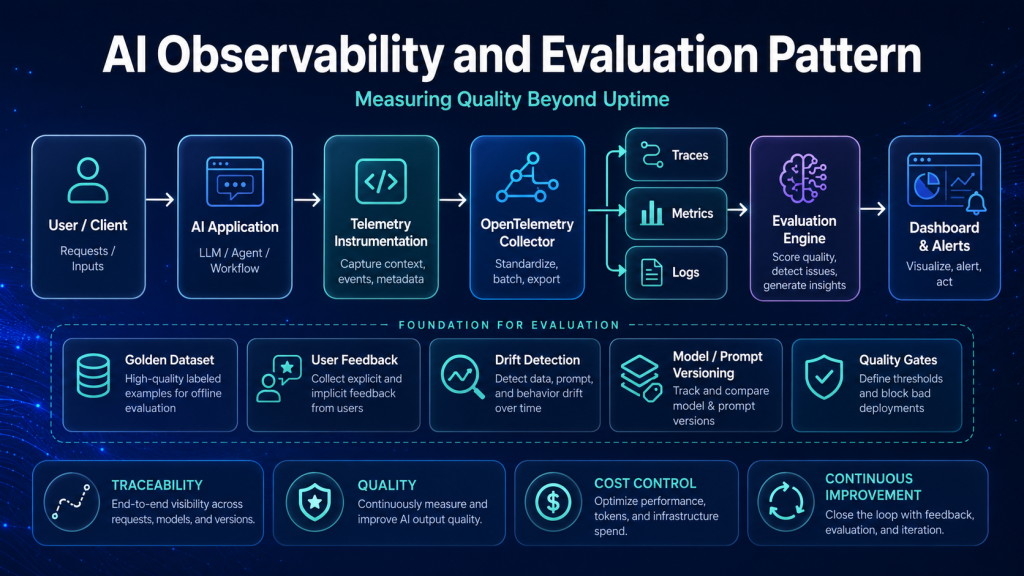
A production-oriented implementation of the AI Observability and Evaluation Pattern may contain the following components:
flowchart LR
    User[User or Client]
    App[AI Application]
    Retriever[Retriever]
    Model[Model Provider]
    Tool[External Tools]

    SDK[Telemetry SDK]
    Collector[OpenTelemetry Collector]
    Trace[(Trace Store)]
    Metrics[(Metrics Store)]
    Logs[(Log Store)]

    Dataset[(Evaluation Dataset)]
    Eval[Evaluation Engine]
    Results[(Evaluation Results)]
    Dashboard[Dashboard]
    Alert[Alert Manager]
    Feedback[User Feedback]

    User --> App
    App --> Retriever
    App --> Model
    App --> Tool

    App --> SDK
    Retriever --> SDK
    Model --> SDK
    Tool --> SDK

    SDK --> Collector
    Collector --> Trace
    Collector --> Metrics
    Collector --> Logs

    App --> Feedback
    Feedback --> Results

    Dataset --> Eval
    Trace --> Eval
    Eval --> Results

    Trace --> Dashboard
    Metrics --> Dashboard
    Logs --> Dashboard
    Results --> Dashboard

    Dashboard --> Alert
AI Application
The AI application may implement:
- Model serving
- Retrieval-augmented generation
- Document processing
- Recommendation
- Classification
- Agentic workflows
- Multimodal processing
It should attach a request ID and trace context to each operation.
Telemetry Instrumentation
Instrumentation captures technical and AI-specific signals.
It may be implemented using:
- OpenTelemetry SDKs
- Framework integrations
- Model provider callbacks
- Custom middleware
- Agent or workflow hooks
OpenTelemetry is vendor-neutral and supports the collection and export of traces, metrics, and logs to different observability backends.
OpenTelemetry Collector
The collector receives telemetry from application services.
It can:
- Receive telemetry through OTLP
- Enrich attributes
- Filter sensitive fields
- Sample traces
- Batch records
- Route signals to different backends
- Retry failed exports
Using a collector separates application instrumentation from the selected storage or visualization product.
Trace Store
The trace store keeps the execution path of each request.
A trace for a RAG request may include spans for:
POST /questions
    |
    +-- validate_request
    |
    +-- create_embedding
    |
    +-- retrieve_documents
    |      |
    |      +-- vector_search
    |      +-- metadata_filter
    |      +-- rerank_results
    |
    +-- build_prompt
    |
    +-- call_language_model
    |
    +-- validate_response
    |
    +-- save_feedback_reference
A trace helps the team identify whether a slow response was caused by retrieval, the model provider, a tool call, a retry, or an internal application operation.
Metrics Store
Metrics summarize system behaviour over time.
Examples include:
- Request count
- Error rate
- Latency percentiles
- Token consumption
- Cost per request
- Retrieval duration
- Evaluation score distributions
- Acceptance rate
- Model invocation count
Prometheus is suitable for time-series operational metrics, while AI-specific platforms may store additional quality and interaction metrics.
Log Store
Logs record important events and diagnostic information.
Logs should normally include:
- Timestamp
- Severity
- Service name
- Request ID
- Trace ID
- Model name
- Model version
- Prompt version
- Error category
- Retry count
Raw prompts and responses should not automatically be logged because they may contain personal or confidential information.
Evaluation Dataset
An evaluation dataset contains representative examples used to test the AI system.
A record may include:
{
  "question": "What is the subscription refund period?",
  "referenceAnswer": "Customers can request a refund within 30 days.",
  "expectedDocumentIds": [
    "refund-policy"
  ],
  "category": "billing-policy",
  "riskLevel": "medium"
}
The dataset should represent:
- Common user requests
- Difficult edge cases
- High-risk scenarios
- Unsupported requests
- Ambiguous questions
- Adversarial inputs
- Historical production failures
Evaluation Engine
The evaluation engine executes one or more evaluators against application results.
Evaluators may be:
- Deterministic
- Statistical
- Model-based
- Human-reviewed
- Business-outcome based
Ragas, for example, provides metrics for RAG and agentic workflows, including context precision, context recall, response relevancy, faithfulness, tool-call accuracy and agent goal accuracy.
Dashboard
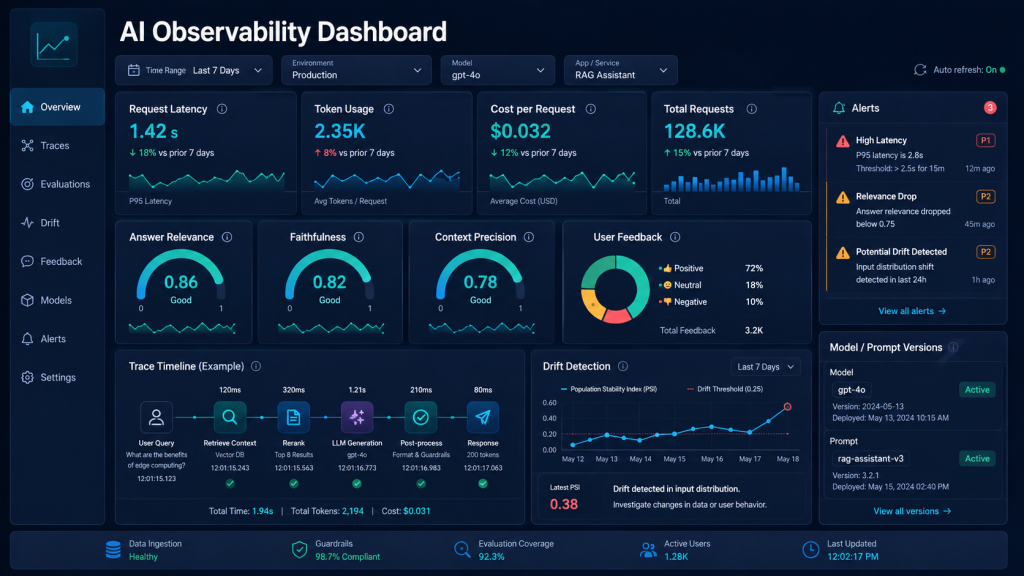
The dashboard combines technical and quality indicators.
A useful dashboard should allow users to filter by:
- Time range
- Model version
- Prompt version
- Customer or tenant
- Request category
- Evaluation result
- Deployment version
- Error type
Alert Manager
Alerts notify the responsible team when a threshold or anomaly is detected.
Examples include:
- Error rate above 2%
- P95 latency above 3 seconds
- Faithfulness below 0.85
- Cost per request increased by 30%
- Retrieval returned no documents
- User rejection rate increased
- Input drift detected
- Candidate model underperformed the baseline
Observability Signals for AI Systems
The pattern should capture multiple categories of signals rather than relying on one global health score.
1. Application and Infrastructure Metrics
These metrics are similar to those used for conventional services:
Request count
Error rate
Availability
CPU utilization
Memory utilization
Network usage
Queue depth
Container restarts
Database connection usage
They show whether the application and infrastructure are functioning correctly.
2. Latency Metrics
End-to-end latency alone may hide the source of a problem.
Latency should be measured for individual components:
Total request latency
Input validation latency
Embedding latency
Retrieval latency
Reranking latency
Prompt construction latency
Model latency
Tool execution latency
Output validation latency
Useful percentiles include:
P50
P90
P95
P99
Averages can hide a small but important group of extremely slow requests.
3. Token and Cost Metrics
Generative AI applications should track:
- Input tokens
- Output tokens
- Cached tokens
- Embedding tokens
- Model calls per request
- Cost per model call
- Cost per request
- Cost per user
- Cost per workflow
- Cost per successful outcome
For an agentic workflow, one user request may trigger several model calls and tool executions. Looking only at the cost of one model invocation can significantly underestimate the total workload cost.
4. Model and Configuration Metadata
Every trace should identify the configuration that produced the response:
Model provider
Model name
Model version
Temperature
Maximum tokens
Prompt identifier
Prompt version
Embedding model
Retriever version
Reranker version
Application version
Without this metadata, teams cannot reliably compare releases or reproduce problematic results.
5. Retrieval Metrics
For a RAG system, observe:
- Number of retrieved chunks
- Retrieval latency
- Similarity scores
- Reranking scores
- Empty-result rate
- Duplicate-result rate
- Source-document distribution
- Context size
- Context precision
- Context recall
Context precision evaluates how much of the retrieved context is relevant, while context recall measures whether the retrieval process found the information needed to answer the question.
6. Generation Quality Metrics
Common generation metrics include:
- Answer relevance
- Faithfulness
- Factual correctness
- Completeness
- Conciseness
- Citation correctness
- Style compliance
- Safety
- Refusal correctness
Faithfulness measures whether claims in an answer can be supported by the supplied context. It is therefore useful for identifying answers that sound plausible but are not grounded in retrieved information.
7. Agent Metrics
An agentic application requires additional signals:
- Number of reasoning steps
- Number of model calls
- Number of tool calls
- Tool selection accuracy
- Tool execution failures
- Repeated tool calls
- Maximum-step termination
- Human approval requests
- Goal completion rate
A technically successful tool call does not mean that the correct tool was selected.
8. User Feedback Metrics
User feedback may be explicit or implicit.
Explicit feedback includes:
- Thumbs up or down
- Rating
- Correction
- Review comment
- Approval or rejection
Implicit feedback includes:
- User accepted the generated draft
- User repeated the same question
- User edited most of the response
- User abandoned the workflow
- Support ticket was reopened
- Recommendation was selected
Feedback must be interpreted carefully. A user may accept a response because it is convenient, not because it is correct.
9. Business Outcome Metrics
The final objective is not merely to improve an evaluation score.
The system should connect AI behaviour with business outcomes such as:
- Ticket resolution time
- Escalation rate
- Fraud loss reduction
- Conversion rate
- Review workload
- Defect detection rate
- Customer satisfaction
- Cost per resolved case
An AI quality score is useful only when it relates to the intended business result.
Offline and Online Evaluation
AI evaluation should occur both before and after deployment.
Offline Evaluation
Offline evaluation uses a controlled dataset.
Evaluation Dataset
       |
       v
Candidate Application Version
       |
       v
Evaluation Metrics
       |
       v
Comparison with Baseline
It is useful for:
- Regression testing
- Prompt comparison
- Model selection
- Retrieval tuning
- Threshold tuning
- Release approval
Offline evaluation is repeatable because the same examples can be executed against multiple versions.
However, it may not fully represent real production behaviour.
Online Evaluation
Online evaluation assesses real or sampled production interactions.
It can use:
- User feedback
- Human review
- Delayed ground truth
- Model-based scoring
- Business outcomes
- Shadow deployments
- A/B experiments
Online evaluation reflects actual user behaviour but introduces additional concerns around privacy, cost, and operational risk.
A mature system uses both:
Offline evaluation
    → Prevent known regressions before deployment

Online evaluation
    → Detect unexpected problems after deployment
Deterministic and Model-Based Evaluators
Not every evaluation requires another language model.
Deterministic Evaluators
Deterministic evaluators use explicit rules.
Examples include:
- Response contains required fields
- Citation references an existing document
- SQL query executes successfully
- Classification label is valid
- Expected keyword is present
- JSON matches a schema
- Tool argument satisfies a contract
- Response does not exceed a length limit
Advantages:
- Fast
- Low cost
- Repeatable
- Easy to debug
Limitations:
- Cannot judge nuanced language quality
- Require clear expected behaviour
- May be too rigid
Model-Based Evaluators
A language model can assess qualities such as:
- Relevance
- Completeness
- Groundedness
- Tone
- Helpfulness
- Safety
- Policy compliance
Advantages:
- Can evaluate open-ended output
- Supports rubric-based assessment
- Scales more easily than manual review
Limitations:
- Introduces cost and latency
- May produce inconsistent scores
- Can inherit evaluator-model biases
- Requires validation against human judgement
A model-based evaluator should not automatically be treated as ground truth.
It should be calibrated using examples that have been reviewed by subject-matter experts.
Building a Golden Evaluation Dataset
A golden dataset is a curated set of representative test cases with expected outcomes.
It should not contain only straightforward examples.
A balanced dataset may contain:
| Category | Example |
|---|---|
| Common | Frequently asked product question |
| Edge case | Incomplete or ambiguous request |
| High risk | Financial, legal or security-related request |
| Unsupported | Question not covered by available knowledge |
| Adversarial | Prompt injection attempt |
| Historical failure | Input that caused a previous incident |
| Multilingual | Same intent expressed in different languages |
| Long input | Request near the supported size limit |
Each record should include enough metadata to support analysis:
{
  "caseId": "refund-017",
  "question": "Can I cancel after using the annual plan for six weeks?",
  "referenceAnswer": "The standard refund period is 30 days.",
  "expectedBehaviour": "Explain the policy and recommend contacting support.",
  "expectedSources": [
    "refund-policy"
  ],
  "tags": [
    "billing",
    "policy",
    "edge-case"
  ],
  "riskLevel": "medium"
}
The dataset should evolve whenever:
- A production failure occurs
- A user reports an incorrect answer
- A policy changes
- A new use case is introduced
- An adversarial pattern is discovered
A production incident should become a future regression test.
Drift Detection
AI quality can decline even when the application code and model remain unchanged.
This may happen because production input changes.
Examples include:
- New customer terminology
- Different document formats
- New product categories
- Changes in user behaviour
- Seasonal demand
- Changes in fraud patterns
- Changes in source-document quality
Data Drift
Data drift occurs when the distribution of production inputs differs from the reference data.
Prediction Drift
Prediction drift occurs when the distribution of model outputs changes.
Concept Drift
Concept drift occurs when the relationship between input and the correct outcome changes.
When ground-truth labels are delayed or unavailable, feature and prediction drift can be used as proxy indicators that the model is operating in a changed environment. Evidently documents this as a typical use case for identifying potential model-quality degradation.
Drift does not always mean that the model is wrong.
It means that the system requires investigation.
Privacy and Security Considerations
AI observability can create significant privacy risk because prompts, retrieved context, model output and tool results may contain sensitive information.
The architecture should define which content is permitted in telemetry.
Data Minimisation
Collect only the information required for operations and evaluation.
Instead of storing the complete prompt, consider storing:
- Prompt template ID
- Input length
- Content category
- Hashed identifiers
- Redacted excerpts
- Statistical features
Redaction
Sensitive fields should be removed before telemetry export.
Examples include:
- Email addresses
- Phone numbers
- Account numbers
- Authentication tokens
- Personal identifiers
- Confidential document content
Access Control
Different roles may require different access:
| Role | Permitted data |
|---|---|
| Operations | Latency, error and infrastructure metrics |
| AI engineer | Model, retrieval and evaluation metrics |
| Support reviewer | Selected request and response content |
| Security team | Audit events and suspicious activity |
| Business owner | Aggregated outcomes |
Retention
Raw interaction data should generally have a shorter retention period than aggregated metrics.
Evaluation Data Governance
Before production interactions are reused for evaluation or training, the system should verify:
- User consent
- Contractual limitations
- Data residency
- Retention policy
- Anonymisation requirements
- Intellectual-property restrictions
Alerting Strategy
Not every metric should trigger an immediate alert.
Alerts should represent actionable conditions.
Operational Alerts
Examples:
P95 latency > 3 seconds for 10 minutes
Model error rate > 2%
Retrieval service unavailable
Queue depth exceeds capacity
Token usage increases by 50%
Quality Alerts
Examples:
Faithfulness average < 0.85
User rejection rate > 15%
Empty retrieval result rate > 10%
Candidate model underperforms baseline
Citation validation failures increase
Quality alerts may require longer evaluation windows because individual scores can be noisy.
Business Alerts
Examples:
Ticket escalation rate increases
Automated-review approval declines
Support handling time increases
Fraud false-negative rate increases
Alerts should identify:
- Which model version is affected
- Which prompt version is affected
- Which user or request segment is affected
- When the degradation started
- Whether a deployment occurred beforehand
Release Evaluation and Quality Gates
Evaluation can become part of CI/CD.
A candidate release should be tested against the golden dataset before deployment.
Code or Prompt Change
         |
         v
Automated Tests
         |
         v
Offline AI Evaluation
         |
         v
Compare with Baseline
         |
    +----+----+
    |         |
  Pass       Fail
    |         |
Deploy     Block Release
A quality gate might define:
quality_gates:
  minimum_faithfulness: 0.90
  minimum_answer_relevance: 0.85
  minimum_context_precision: 0.80
  maximum_p95_latency_ms: 2500
  maximum_average_cost_usd: 0.03
  maximum_regression_percentage: 3
Quality gates should not rely only on one average score.
The release could improve the overall average while significantly degrading a high-risk subset.
Results should therefore be segmented by:
- Request category
- Risk level
- Language
- Customer segment
- Input length
- Product area
When to Use This Pattern
The AI Observability and Evaluation Pattern should be used when:
- An AI model is deployed into production.
- Output quality cannot be represented by uptime alone.
- Models, prompts or retrieval configurations change over time.
- The organisation needs to investigate individual results.
- AI decisions influence customers or business processes.
- Cost and token consumption require control.
- Drift or quality degradation must be detected.
- Teams need evidence before promoting a new model version.
- Human feedback is available.
- The system uses RAG, generative AI or agentic workflows.
In practice, observability and evaluation should be designed at the beginning of an AI project rather than added after an incident.
When a Simpler Approach May Be Enough
A complete AI observability platform may be unnecessary for a small prototype when:
- The application is not exposed to real users.
- No sensitive or business-critical decision is involved.
- A fixed test dataset is sufficient.
- The system has limited traffic.
- Models and prompts are not changing frequently.
- Manual review covers every result.
Even in these cases, the prototype should retain basic request IDs, model versions and evaluation tests so that it can evolve without losing traceability.
Demo Repository
The accompanying repository will demonstrate observability and evaluation for a small RAG-based knowledge assistant.
ai-pattern-observability-evaluation
The implementation will include:
- FastAPI knowledge-assistant API
- Mock and configurable model providers
- Simple document retrieval
- OpenTelemetry instrumentation
- OpenTelemetry Collector
- Jaeger distributed tracing
- Prometheus metrics
- Grafana dashboards
- Structured application logs
- Token and cost tracking
- Prompt and model version tracking
- Offline evaluation dataset
- Deterministic evaluators
- RAG quality evaluation
- User-feedback endpoint
- Drift report generation
- CI quality gates
- Docker Compose
- Unit and integration tests
Proposed Repository Structure
ai-pattern-observability-evaluation/
├── README.md
├── LICENSE
├── Makefile
├── .env.example
├── docker-compose.yml
├── pyproject.toml
├── config/
│   ├── otel-collector.yaml
│   ├── prometheus.yaml
│   └── grafana/
├── datasets/
│   ├── golden-dataset.json
│   ├── reference-inputs.csv
│   └── production-inputs.csv
├── docs/
│   ├── architecture.md
│   ├── evaluation-strategy.md
│   ├── telemetry-schema.md
│   ├── security.md
│   └── production-readiness.md
├── src/
│   ├── main.py
│   ├── api/
│   │   ├── routes/
│   │   │   ├── questions.py
│   │   │   ├── feedback.py
│   │   │   ├── evaluations.py
│   │   │   └── health.py
│   │   └── middleware.py
│   ├── application/
│   │   ├── question_service.py
│   │   └── evaluation_service.py
│   ├── domain/
│   │   ├── models.py
│   │   └── interfaces.py
│   ├── infrastructure/
│   │   ├── model_provider/
│   │   ├── retrieval/
│   │   ├── telemetry/
│   │   ├── evaluation/
│   │   └── feedback/
│   └── settings.py
├── scripts/
│   ├── run_evaluation.py
│   ├── compare_releases.py
│   ├── generate_drift_report.py
│   └── seed_documents.py
├── tests/
│   ├── unit/
│   ├── integration/
│   └── evaluation/
└── .github/
    └── workflows/
        ├── ci.yml
        └── evaluation-gate.yml
Target Developer Experience
git clone https://github.com/VuiLenDi/ai-pattern-observability-evaluation.git
cd ai-pattern-observability-evaluation

cp .env.example .env
docker compose up --build
Services:
API documentation:
http://localhost:8000/docs

Grafana:
http://localhost:3000

Prometheus:
http://localhost:9090

Jaeger:
http://localhost:16686
Run offline evaluation:
make evaluate
Generate a drift report:
make drift-report
Compare a candidate release with the baseline:
make compare-releases
Production Readiness Checklist
Traceability
- Every request has a request ID and trace ID.
- The model version is recorded.
- The prompt version is recorded.
- Retrieval and tool operations appear in the trace.
- Evaluation results can be linked to the originating request.
Operational Monitoring
- Request volume and error rate are available.
- Component-level latency is measured.
- Token consumption and cost are monitored.
- Infrastructure capacity is monitored.
- Actionable alerts are configured.
Quality Evaluation
- A representative evaluation dataset exists.
- High-risk cases are evaluated separately.
- Deterministic checks are implemented where possible.
- Model-based evaluators are validated against human judgement.
- Candidate releases are compared against a baseline.
Data and Drift
- Input distributions are monitored.
- Prediction distributions are monitored.
- Drift thresholds are documented.
- Drift triggers investigation rather than automatic retraining.
- Ground-truth outcomes are collected where possible.
Security and Privacy
- Sensitive prompts and responses are not logged by default.
- Telemetry redaction is implemented.
- Access to interaction data is restricted.
- Retention periods are documented.
- Evaluation and training reuse follows data-governance rules.
Operations
- Dashboard ownership is assigned.
- Alert response procedures exist.
- Quality incidents can trigger rollback.
- Production failures are added to the evaluation dataset.
- Business owners review outcome metrics.
Key Takeaways
The AI Observability and Evaluation Pattern helps teams understand not only whether an AI system is running, but whether it continues to provide acceptable results.
A complete implementation connects:
Technical telemetry
        +
AI quality metrics
        +
User feedback
        +
Business outcomes
Traditional logs and infrastructure metrics remain essential, but they cannot identify every AI quality failure.
Production AI systems should be able to answer:
- Which model produced this result?
- Which prompt and data were used?
- Which documents were retrieved?
- Which tools were called?
- How much did the request cost?
- Was the output relevant and grounded?
- Did users accept the outcome?
- Did the new release improve or degrade performance?
Observability makes an AI system explainable from an operational perspective.
Evaluation makes its quality measurable.
Together, they provide the feedback loop required to maintain reliable AI applications over time.
The next article in this series will explore the Batch AI Pipeline Pattern, showing how organisations can process large-scale AI workloads when real-time inference is unnecessary.