


Introduction
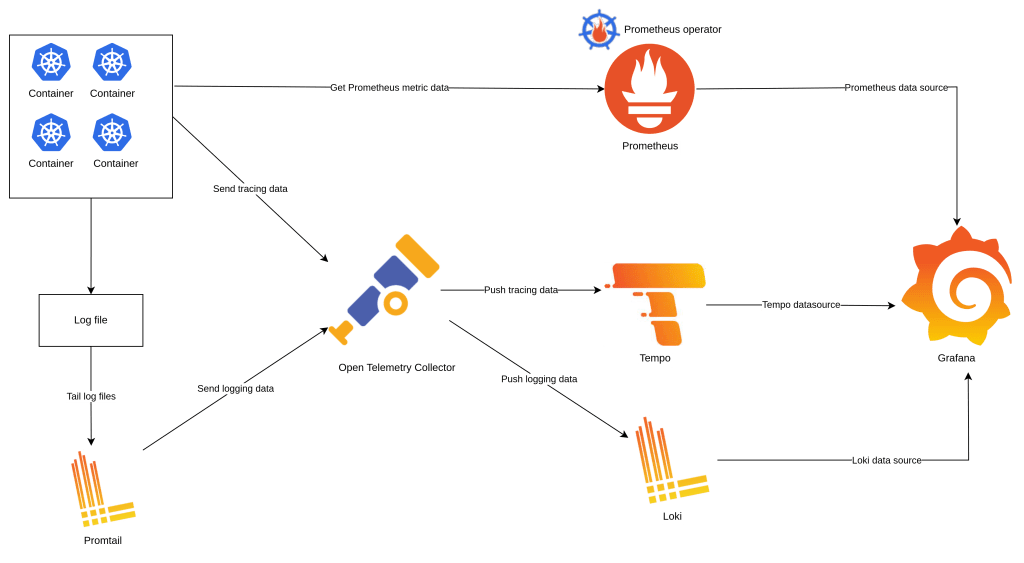
Observability of a system includes Logging, Tracing and Metric. Today, we will go to detail how to implement observability’s elements on a K8S environment use Promtail, Open Telemetry Collector, Loki, Tempo and Grafana bellow is the demonstration of system we will implement
Open Telemetry collector
Open Telemetry Collector is a distributor the log, tracing, metric data, The Open Telemetry Collector receive, process and export data( Logging, Tracing, Metric ) to another consumption servers (Tempo, Loki), detail of Open Telemetry reference on https://opentelemetry.io/docs/collector.
The first step we need install a Open Telemetry Collector Operator on the K8s environment, that is a custom resource definition (crd) help we facilitate config Open Telemetry Collector reference on https://github.com/open-telemetry/opentelemetry-operator
In Open Telemetry Operator, the webhook requires a TLS certificate that the API server is configured to trust, we need to install cert-manager more detail https://github.com/open-telemetry/opentelemetry-helm-charts/tree/main/charts/opentelemetry-operator
helm repo add jetstack https://charts.jetstack.io
helm repo add open-telemetry https://open-telemetry.github.io/opentelemetry-helm-chartshelm repo update

helm upgrade --install cert-manager jetstack/cert-manager \
  --namespace cert-manager \
  --create-namespace \
  --version v1.12.0 \
  --set installCRDs=true \
  --set prometheus.enabled=false \
  --set webhook.timeoutSeconds=4 \
  --set admissionWebhooks.certManager.create=true

helm upgrade --install opentelemetry-operator open-telemetry/opentelemetry-operator \
--create-namespace --namespace observability
Logging
We will use Promtail as agent to collect the log of all pods is running in the Kubernetes cluster, the log data will be sent to Loki as a Backend log server through Open Telemetry Collector, the fist a Loki server need to set up and a pipeline on the Open Telemetry will configured order to receive the log data sent from Promtail server and export to Loki server
Install Loki server
After install success the Open Telemetry Collector Operator crd, now we move on to implement the logging on the K8s environment, we need a log data server that is Loki, more detail in https://grafana.com/oss/loki/ and the deployment mode using is simple scalable https://grafana.com/docs/loki/latest/fundamentals/architecture/deployment-modes/#simple-scalable-deployment-mode
Create a value setting file loki.values.yaml to install Loki server
write:
  replicas: 1
read:
  replicas: 1
backend:
  replicas: 1
loki:
  commonConfig:
    replication_factor: 1
  auth_enabled: false
test:
  enabled: false
storage:
  type: 'filesystem'
minio:
  enabled: true

monitoring:
  selfMonitoring:
    enabled:
false
    grafanaAgent:
installOperator: falseAll replica scale to 1, default in the helm chart is 3 and I also disable the authenticationwrite: replicas: 1 read: replicas: 1 backend: replicas: 1 loki: commonConfig: replication_factor: 1 auth_enabled: false
Here is the config store data to file system and we need to enabled minio, a component help store data to file system on the production environment you can store data to S3 Amazontest: enabled: false storage: type: 'filesystem' minio: enabled: true
Use helm command line to install the Loki server, the helm chart reference on https://github.com/grafana/loki/tree/main/production/helm/loki
helm repo add grafana https://grafana.github.io/helm-charts
helm upgrade --install loki grafana/loki \
--create-namespace --namespace observability \-f ./loki.values.yaml
Config Open Telemetry Collector pipeline for logging
Create opentelemetry-collector.yaml file to config the Open Telemetry Controller pipeline and use the kubectl command to apply this filekubectl apply -f ./opentelemetry-collector.yaml -n observability
apiVersion: opentelemetry.io/v1alpha1
kind: OpenTelemetryCollector
metadata:
  name: opentelemetry
spec:
  mode: deployment
  ports:
    - name: loki
      port: 3500
      protocol: TCP
      targetPort: 3500
  config: |
    receivers:
      loki:
        protocols:
          http:
            endpoint: 0.0.0.0:3500
        use_incoming_timestamp: true
    processors:
      attributes:
        actions:
          - action: insert
            key: loki.attribute.labels
            value: namespace,container,pod,level,traceId
          - action: insert
            key: loki.format
            value: raw

    exporters:
      loki:
        endpoint: http://loki-gateway/loki/api/v1/push
    service:
      pipelines:
        logs:
          receivers: [loki]
          processors: [attributes]
exporters: [loki]Specify deploy Open Telemetry run as a Kubernetes deployment, you can select another modemode: deploymentDaemonSet,Sidecarreference on https://github.com/open-telemetry/opentelemetry-operator#deployment-modes
The setting open port 3500 on the Open Telemetry serverports: - name: loki port: 3500 protocol: TCP targetPort: 3500
The loki receiver configuration specify listen on port 3500 to understand more receiver, processor, exporter configuration of Open Telemetry Controller reference on https://opentelemetry.io/docs/collector/configuration, Loki receiver https://github.com/open-telemetry/opentelemetry-collector-contrib/tree/main/receiver/lokireceiverreceivers: loki: protocols: http: endpoint: 0.0.0.0:3500 use_incoming_timestamp: true
The processor configuration notify for Loki server make- action: insert key: loki.attribute.labels value: namespace,container,pod,level,traceIdnamespace,container,pod,level,traceIdas indexs
Because the Loki receiver receive the log data from promtail, the log format already formatted by promtail so we don’t need to change the log format before send to Loki server- action: insert key: loki.format value: raw
The exporter configuration specify the Loki URL service on Kubernetes cluster installed before more detail reference on https://github.com/open-telemetry/opentelemetry-collector-contrib/tree/main/exporter/lokiexporterexporters: loki: endpoint: http://loki-gateway/loki/api/v1/push
Install promtail to collect the log
After finish install Loki server and configure the Open Telemetry Collector pipeline, we need to install Promtail to collect the log and send to Open Telemetry collector server detail Promtail reference on https://grafana.com/docs/loki/latest/clients/promtail
Create promtail.values.yaml file to setting for Promtail helm chart https://github.com/grafana/helm-charts/blob/main/charts/promtail/values.yaml
config:
clients:
- url: http://opentelemetry-collector:3500/loki/api/v1/push
snippets:
pipelineStages:
- docker: {}The configuration specify the Service URL Open Telemetry Collector on the Kubernetes clusterclients:
- url: http://opentelemetry-collector:3500/loki/api/v1/push
The configuration specify the format log issnippets:
pipelineStages:
- docker: {}docker, default iscrithe format log base on the container runtime setup on Kubernetes cluster, usekubectl get nodes -o widecommand line to know the container runtime have been setup
Use helm command line to install Promtail
helm repo add grafana https://grafana.github.io/helm-charts
helm repo update
helm upgrade --install promtail grafana/promtail \
--create-namespace --namespace observability \
--values ./promtail.values.yaml
Config logging pattern in Application
Promtail, Open Telemetry Collector pipeline, Loki already setup success and now we need config your log application follow by log formats used on Loki, bellow is logging configuration I used on a Spring Boot application
logging:
pattern:
level: application=${spring.application.name} traceId=%X{traceId:-} spanId=%X{spanId:-} level=%levelThe log will output like below2023-07-12T10:24:38.204Z application=order traceId=2c527d33ff4a100cd367f970a5441467 spanId=ae80b01e07052d89 level=INFO 1 --- [p-nio-80-exec-3] com.yas.order.service.OrderService : Order Success: com.yas.order.model.Order@4c72b692Base on the the Open Telemetry Controller pipeline config above Loki server will index the traceId, level fields
Tracing
The tracing help we trace a request base on the trace Id, we easy to know the path of request or message from source microservice to destination microservice, similar with Logging we also create the pipeline on the Open Telemetry Controller, however the tracing data will send from your application and the destination is Tempo server and now we will go to the first step install the Tempo server
Install Tempo Server
Tempo is one of Grafana components, that is a tracing backend server more detail reference on https://grafana.com/oss/tempo/ and we will use the helm chart to install the Tempo server https://github.com/grafana/helm-charts/tree/main/charts/tempo
Create tempo.values.yaml file to overwrite values of helm chart
tempo:
metricsGenerator:
enabled: true
remoteWriteUrl: "http://prometheus-kube-prometheus-prometheus:9090/api/v1/write"The url of Prometheus service that enabled remote write, will implemented laterremoteWriteUrl: "http://prometheus-kube-prometheus-prometheus:9090/api/v1/write"
Use the helm command line to install the Tempo server
helm repo add grafana https://grafana.github.io/helm-charts
helm repo update
helm upgrade --install tempo grafana/tempo \
--create-namespace --namespace observability \
-f ./tempo.values.yaml
Add Open Telemetry Collector pipeline to receive and export tracing data
After install Tempo success we need to add the pipeline on Open Telemetry collector, use the old pipeline have created before and use kubectl command to apply the manifest file kubectl apply -f ./opentelemetry-collector.yaml -n observability
apiVersion: opentelemetry.io/v1alpha1
kind: OpenTelemetryCollector
metadata:
name: opentelemetry
spec:
mode: deployment
ports:
  - name: loki
    port: 3500
    protocol: TCP
    targetPort: 3500
config: |
receivers:
   loki:
     protocols:
       http:
          endpoint: 0.0.0.0:3500
     use_incoming_timestamp: true
otlp:
protocols:
grpc:
endpoint: 0.0.0.0:4317
http:
endpoint: 0.0.0.0:4318
processors:
batch:
attributes:
actions:
- action: insert
  key: loki.attribute.labels
  value: namespace,container,pod,level,traceId
- action: insert
  key: loki.format
  value: raw
exporters:
  loki:
    endpoint: http://loki-gateway/loki/api/v1/push
otlphttp:
endpoint: http://tempo:4318
service:
pipelines:
logs:
receivers: [loki]
processors: [attributes]
exporters: [loki]
traces:
receivers: [otlp]
processors: [batch]
exporters: [otlphttp]We add a new receiver otlp listen on 4317, 4318 there are two port default of Open Telemetry Controller server so don’t need to define the open ports in the ports specotlp:
protocols:
grpc:
endpoint: 0.0.0.0:4317
http:
endpoint: 0.0.0.0:4318
We also add a exporter to push tracing data to temp server on port 4318 the port already open on Tempo serverotlphttp: endpoint: http://tempo:4318
Config application to send tracing data to Open Telemetry Collector server
The source of tracing data will get from your application bellow is the config I used on a Spring boot application to send Tracing data to Open Telemetry
management:
otlp:
tracing:
endpoint: http://opentelemetry-collector.observability:4318/v1/traces
tracing:
sampling:
probability: 1.0Config the Open Telemetry Collector URL to send tracing dataotlp: tracing: endpoint: http://opentelemetry-collector.observability:4318/v1/traces
Metric
When we want to collect the metric data, most of system always use a Prometheus Server to collect the metric data from applications through scrape configs defined on Prometheus server, However in the Kubernetes environment have a CRD (Custom Resource Definitions) that is Prometheus Operator help we easy to config monitoring components more detail reference on https://github.com/prometheus-operator/prometheus-operator, now we go the installation for metric on the Kubernetes
Install Prometheus Operator (Install both Prometheus and Grafana Servers)
To understand more how to use Prometheus Operator reference on getting started page https://github.com/prometheus-operator/prometheus-operator, to install the Promethus Operator I will use kube-prometheus-stack helm chart https://github.com/prometheus-community/helm-charts/tree/main/charts/kube-prometheus-stack, the helm chart include the Grafana server chart, so I will use this helm chart install both Prometheus server and Grafana servers
Create prometheus.values.yaml to define the config for the Promethues and Grafa servers
prometheus:
prometheusSpec:
enableRemoteWriteReceiver: true
grafana:
grafana.ini:
database:
type: postgres
host: postgresql.postgres:5432
name: grafana
user: postgres
password: admin
ssl_mode: require
adminUser: admin
adminPassword: admin
ingress:
enabled: true
hosts:
- grafana.local.comThe configuration enable remote write used by Tempo server we have define on above section more detail reference https://prometheus.io/docs/concepts/remote_write_spec/prometheus: prometheusSpec: enableRemoteWriteReceiver: true
Here is the configuration for Grafana Server, the database configuration if not config the Grafana server will be use sqlite3 as default, and data will be lost when restart server, I also set admin user for Grafana and enable ingress for Grafana servergrafana: grafana.ini: database: type: postgres host: postgresql.postgres:5432 name: grafana user: yasadminuser password: admin ssl_mode: require adminUser: admin adminPassword: admin ingress: enabled: true hosts: - grafana.local.com
Use helm command line to install Prometheus Operator and both Prometheus, Grafana servers
helm repo add prometheus-community https://prometheus-community.github.io/helm-charts
helm repo update
helm upgrade --install prometheus prometheus-community/kube-prometheus-stack \
--create-namespace --namespace observability \
-f ./observability/prometheus.values.yaml
Configure application export Promethues metric data
Here is the configuration in application.yaml of an Spring boot application to enable export Promethues metric data through 8090 port, the configuration also include config for logging and tracing above
management:
otlp:
tracing:
endpoint: http://opentelemetry-collector.observability:4318/v1/traces
server:
port: 8090
health:
readinessstate:
enabled: true
livenessstate:
enabled: true
tracing:
sampling:
probability: 1.0
metrics:
tags:
application: ${spring.application.name}
endpoints:
web:
exposure:
include: prometheus, health
endpoint:
health:
probes:
enabled: true
show-details: always
logging:
    pattern:
      level: application=${spring.application.name} traceId=%X{traceId:-} spanId=%X{spanId:-} level=%level
Create service monitoring for application
Now I use the CRD of Promethues Operator to monitoring an application, when use install the helm chart of Prometheus Operator it also install CRDs help you create manifest yaml files Kubernetes to monitor service or pod of application. Here is example I monitor an application through service port
Example we have a Kubernetes Service for application export the metric port on 8090
apiVersion: v1
kind: Service
metadata:
  name: order-service
  labels:
    app.kubernetes.io/name: order-service
spec:
  type: ClusterIP
  ports:
    - port: 80
      targetPort: http
      protocol: TCP
      name: http
    - port: 8090
      targetPort: metric
      protocol: TCP
      name: metric
  selector:
    app.kubernetes.io/name: order
Base on the Service defined I create a service monitoring manifest yaml files save as to monitoring-service.yaml file
apiVersion: monitoring.coreos.com/v1
kind: ServiceMonitor
metadata:
  name: order-service-monitoring
  labels:
    release: prometheus
spec:
  selector:
    matchLabels:
      app.kubernetes.io/name: order-service
  endpoints:
    - port: 'metric'
path: '/actuator/prometheus'The Kubernetes Service name of applicationselector: matchLabels: app.kubernetes.io/name: order-service
The port name of service and the path export Promethues data metricendpoints: - port: 'metric' path: '/actuator/prometheus'
Use the kubectl to apply the manifest yaml file. Note that you must apply the monitoring service file same namespace of the service you created beforekubectl apply -f monitoring-service.yaml -n app
Put all Logging, Tracing, Metric to Grafana
After install and config all elements for Logging, Tracing and Metric, we will aggregate all to Grafana use the Grafana Operator to create data sources and dashboard also on Grafana
Grafana Operator
Grafana Operator facilitate to adding the data sources, dashboard to Grafana server without change the config file and restart server on the Kubernetes Cluster, more detail reference https://github.com/grafana-operator/grafana-operator and official document on https://grafana-operator.github.io/grafana-operator/
I use the helm chart to install both Grafana Operator server and CRDs after that we will create some manifest yaml file to add the initial data sources and dashboards more detail installation https://grafana-operator.github.io/grafana-operator/docs/installation/helm/
helm upgrade --install grafana-operator oci://ghcr.io/grafana-operator/helm-charts/grafana-operator \
--version v5.0.2 \
--create-namespace --namespace observability
Add a Grafana definition
Create a Secret Kubernetes grafana-credentials.secret.yaml file to declare the admin username and password of Grafana server created on previous step (Install Prometheus Operator) kubectl apply -f grafana-credentials.secret.yaml -n observability
kind: Secret
apiVersion: v1
metadata:
  name: grafana-admin-credentials
stringData:
  username: "admin"
  password: "admin"
type: Opaque
Create a manifest yaml file grafana.yaml kind Grafana to notfiy the Grafana Operator connect to the Grafana server, more detail reference kubectl apply -f grafana.yaml -n observability
apiVersion: grafana.integreatly.org/v1beta1
kind: Grafana
metadata:
  name: grafana
  labels:
    dashboards: "grafana"
spec:
  external:
    url: http://prometheus-grafana
    adminPassword:
      name: grafana-admin-credentials
      key: username
    adminUser:
      name: grafana-admin-credentials
key: passwordSpecify the url of Grafana server created before, you can a Grafa server without type external reference on https://grafana-operator.github.io/grafana-operator/docs/examples/external_grafana/readme/external: url: http://prometheus-grafana
Declare admin username and password through secretadminPassword: name: grafana-admin-credentials key: username adminUser: name: grafana-admin-credentials key: password
Define Grafana Loki data sources
The Prometheus added default when we install the Prometheus Operator, so we just add Loki, Tempo data source to show log and tracing on Grafana
Create loki-datasource.yaml file with the kind is GrafanaDatasource, the Grafana Operator will call the the api on the Grafana server to add the data sourcekubectl apply -f loki-datasource.yaml -n observability
apiVersion: grafana.integreatly.org/v1beta1
kind: GrafanaDatasource
metadata:
  name: loki-datasource
spec:
  instanceSelector:
    matchLabels:
      dashboards: "grafana"
  datasource:
    name: Loki
    type: loki
    uid: loki
    url: http://loki-gateway
    access: proxy
    jsonData:
      httpMethod: GET
      maxLines: 1000
      derivedFields:
        - datasourceUid: tempo
          matcherRegex: traceId=(\w*)
          name: traceId
url: ${__value.raw}Define a Grafana data source for Loki reference https://grafana.com/docs/grafana/latest/datasources/loki/datasource:name: Loki type: loki uid: loki url: http://loki-gateway access: proxy jsonData: httpMethod: GET maxLines: 1000 derivedFields: - datasourceUid: tempo matcherRegex: traceId=(\w*) name: traceId url: ${__value.raw}
Detect the traceId in the log, use value of traceId show the tracing path on the tempo server- datasourceUid: tempo matcherRegex: traceId=(\w*) name: traceId url: ${__value.raw}
Define Grafana Tempo data sources
Similar as Loki data source, we also create a yaml file tempo-datasource.yaml with kind GrafanaDatasource to declare a data source on Grafana server but for Tempo serverkublectl apply -f tempo-datasource.yaml -n observability
apiVersion: grafana.integreatly.org/v1beta1
kind: GrafanaDatasource
metadata:
  name: tempo-datasource
spec:
  instanceSelector:
    matchLabels:
      dashboards: "grafana"
  datasource:
    name: Tempo
    type: tempo
    uid: tempo
    access: proxy
    url: http://tempo:3100
    jsonData:
      httpMethod: GET
      tracesToLogsV2:
        datasourceUid: loki
      serviceMap:
        datasourceUid: prometheus
      nodeGraph:
        enabled: true
      search:
        hide: false
      lokiSearch:
datasourceUid: lokiWe also specify the Grafana server by the labelinstanceSelector: matchLabels: dashboards: "grafana"
Define Grafana Tempo data source detail of Tempo data source reference https://grafana.com/docs/grafana/latest/datasources/tempo/datasource: name: Tempo type: tempo uid: tempo access: proxy url: http://tempo:3100 jsonData: httpMethod: GET tracesToLogsV2: datasourceUid: loki serviceMap: datasourceUid: prometheus nodeGraph: enabled: true search: hide: false lokiSearch: datasourceUid: loki
Specify the Promethues data source that is added when install Grafana serverserviceMap: datasourceUid: prometheus
Define Grafana dashboards
After data sources added, we need to define some default dashboard to monitoring your application, I will add the jvm and hikari-cp dashboards. We also use the CRD of Grafana Operator to create dashboards with the kind is GrafanaDashboard
Create grafana-dashboards.yaml file defines dashboard that you want add to Grafana server kubectl apply -f grafana-dashboards.yaml -n observability
apiVersion: grafana.integreatly.org/v1beta1
kind: GrafanaDashboard
metadata:
name: jvm-dashboard
spec:
instanceSelector:
    matchLabels:
      dashboards: "grafana"
url: "https://grafana.com/api/dashboards/4701/revisions/10/download"
datasources:
- datasourceName: prometheus
   inputName: DS_PROMETHEUS
---
apiVersion: grafana.integreatly.org/v1beta1
kind: GrafanaDashboard
metadata:
name: hikari-cp-dashboard
spec:
instanceSelector:
matchLabels:
dashboards: "grafana"
url: "https://grafana.com/api/dashboards/6083/revisions/5/download"
datasources:
- datasourceName: prometheus
inputName: DS_PROMETHEUSThe dashboard’s url, you can define the json data reference https://grafana-operator.github.io/grafana-operator/docs/dashboards/url: "https://grafana.com/api/dashboards/4701/revisions/10/download"
Specify Promethues data source for the- datasourceName: prometheus inputName: DS_PROMETHEUSDS_PROMETHEUSvariation
Result on Grafana
After above steps finished, now we let check Logging, Tracing and Metric on the Grafana server
View Logging and Tracing
Login to Grafana server with you username and password that you have been set up from menu select Expore, data source is Loki, Label filters select container


Base on the traceId we can see the tracing infor on the Tepo by click to the derivation link, in the Temp it will show applications that called in a request, the tracing illustrated by Node graph and Service Graph help view the path of request easier


View metric information of application
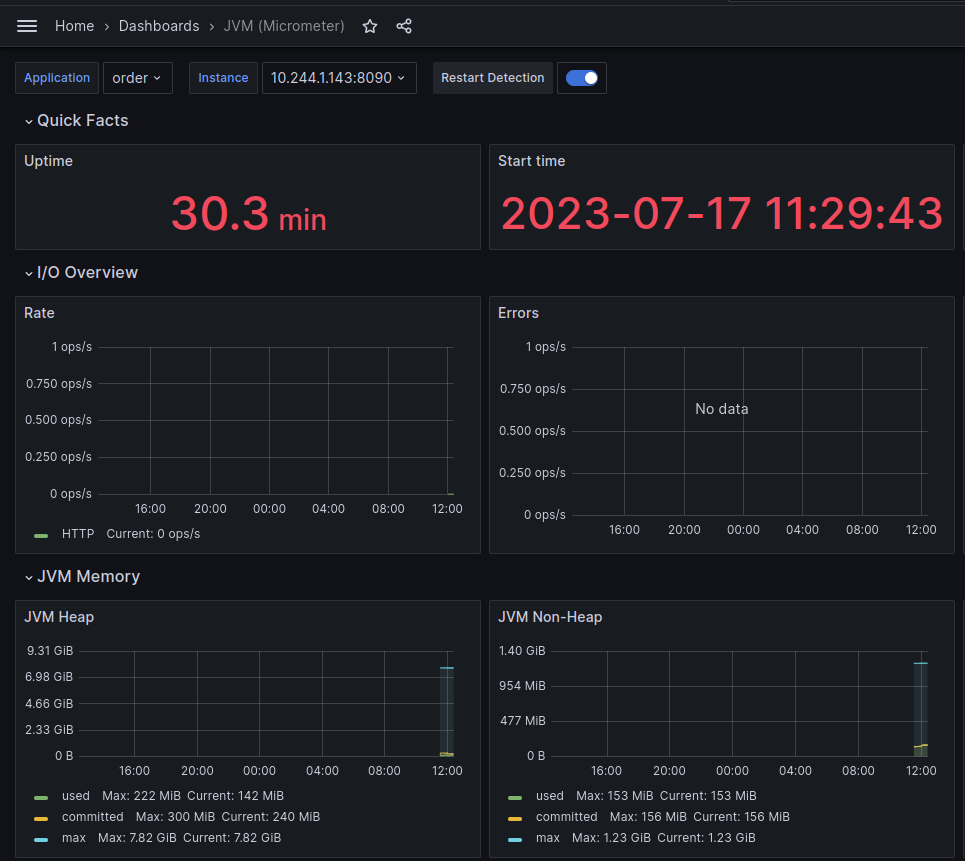
We have added some dashboards for Grafana server when install the Promethues, now we will use those dashboards to monitor applications (Java Spring boot application) .
On the menu select Dashboards -> JVM(micrometer), Select your Application
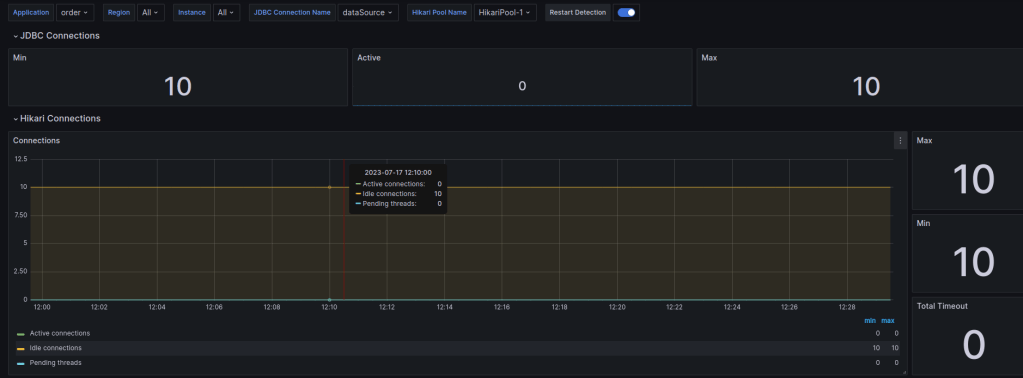
You also can monitor the database connection by the Spring Boot HikariCP dashboard
Conclusion
Base on the tools Tempo, Loki we have centralized the observability on one location that is Grafana and you can search the log and view the tracing on a screen don’t need another tools . All of the above installations I already applied in the YAS project if you interesting please reference on https://github.com/nashtech-garage/yas