


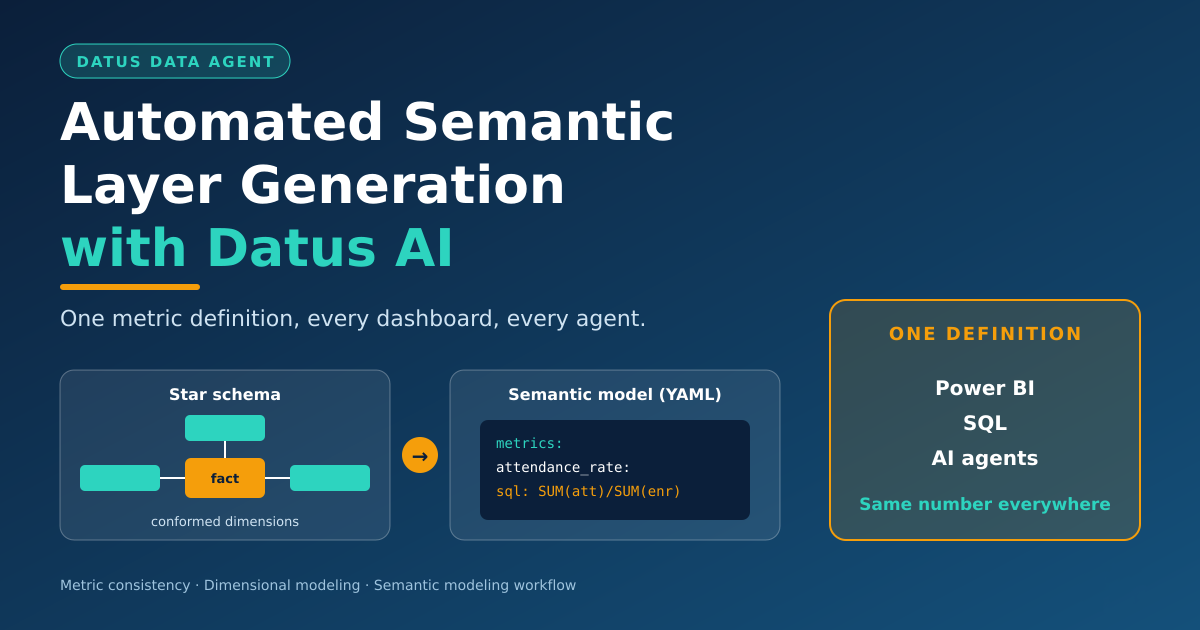
In the last blog, we compared Kimball, Data Vault, and Medallion, and recommended a Medallion plus Data Vault design with a dimensional gold layer. That gold layer is well modeled. However, it is not yet easy to use.
Two analysts can still query the same tables and report different attendance rates. This is where semantic layer generation comes in. In this blog, we explain why semantic layers matter, how they protect metric consistency, and how Datus AI automates their creation.
If you are new to the series, start with why analytics projects fail before they begin. Then read about the unified data engineering operating model, AI-assisted platform planning, business questions to analytics architecture, reliable data pipelines, and metadata-driven engineering.
Why Semantic Layers Matter?
A semantic layer sits between your gold tables and your consumers. It translates tables and columns into business terms such as “attendance rate” or “chronic absenteeism.” As a result, people ask questions in business language, and the layer writes the SQL.
Without it, every tool keeps its own logic. Consequently, the same metric gets rebuilt in each dashboard, notebook, and AI prompt. Each copy drifts over time.
A semantic layer gives you three benefits:
- One definition of each metric, stored in one place.
- Governed access, because filters such as privacy suppression are applied automatically.
- Safer AI, since an agent selects a named metric instead of guessing at joins.
Metric Consistency in the California School Performance Card
Our running scenario is the California School Performance Card. The attendance rate looks simple. Yet there are two common ways to calculate it, and they give different answers.
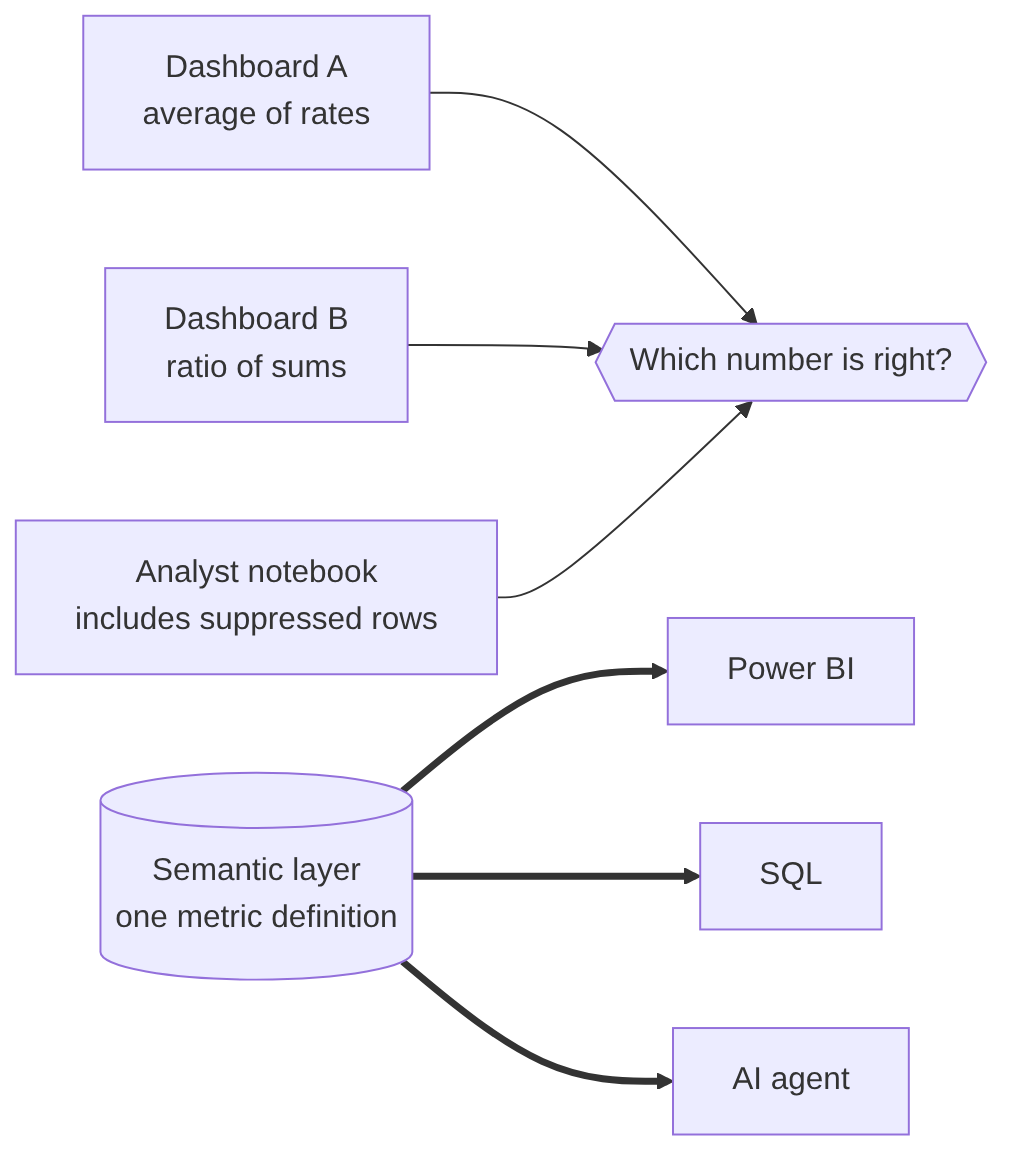
Without a semantic layer, three consumers disagree. With one, they all read the same definition.
The first method averages each row’s rate. The second divides total days attended by total days enrolled. Small schools distort the first method, because a school with 8 students counts as much as one with 400.
We ran both against our sample star schema. The data is synthetic and illustrative.
ratio-of-sums=91.77 average-of-rates=92.07The gap is only 0.3 points. Even so, a ranking of districts can change because of it. A semantic layer fixes one definition, and the ratio of sums is the correct choice here. Suppressed rows (groups under 11 students) are also excluded by default. Therefore, no dashboard can leak small-cell data by accident.
Dimensional Modeling as the Foundation
Semantic layers work best on a dimensional model. A fact table holds measurable events. Dimension tables hold descriptive context. Together they form a star schema.
Our sample has one fact table and two conformed dimensions:
fact_attendance(school_key, group_key, school_year,
                days_enrolled, days_attended, is_suppressed)
dim_school(school_key, school_name, district, county)
dim_student_group(group_key, group_name)
The fact table’s grain is one row per school, student group, and year. Datus infers this grain from the profiling results and key constraints. Dimensions are conformed, meaning every fact table that uses dim_school shares the same school definition. That is what lets you compare attendance with test scores later.
Business-Friendly Data Consumption
Business users do not want to write joins. They want to select “Attendance rate by district.” The semantic layer makes this possible because it knows the join paths and the metric logic.
Consumers can then use the same model in several ways:
- Power BI reads it as a governed dataset.
- Analysts query it through generated SQL.
- Datus agents answer natural-language questions against it.
Moreover, descriptions travel with the metric. An AI agent reading “Share of enrolled days attended” is far less likely to misuse the field than one reading days_attended.
The Datus Semantic Modeling Workflow
Datus follows a seven-step workflow. It is automated, yet it keeps a human in the loop for business definitions. The Datus semantic modeling workflow, from profiling to monitoring.
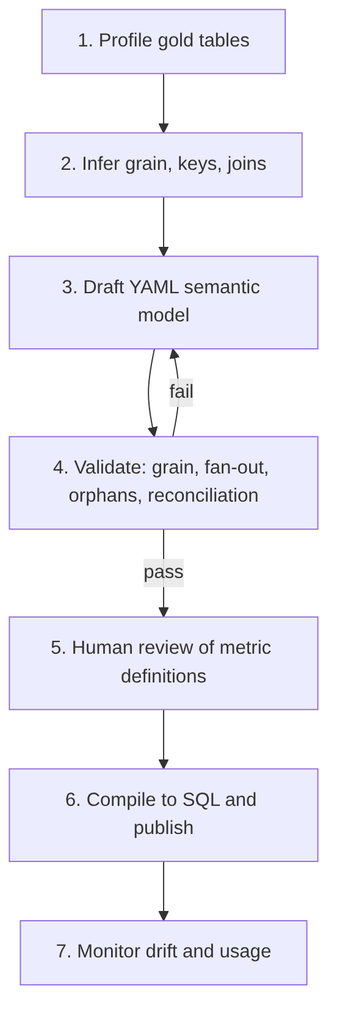
Step 1 and 2 (Profile and infer): Datus reads the gold tables and the metadata captured in earlier blogs. It then proposes the grain, keys, and join paths.
Step 3 (Draft the model) Datus writes a YAML semantic model. The file below is the output for our scenario.
model: school_performance
fact: fact_attendance
grain: [school_key, group_key, school_year]
joins:
  dim_school:        {key: school_key}
  dim_student_group: {key: group_key}
filters:
  default: "is_suppressed = 0"
metrics:
  attendance_rate:
    description: "Share of enrolled days attended (ratio of sums)"
    sql: "ROUND(100.0 * SUM(days_attended) / SUM(days_enrolled), 2)"
dimensions:
  school:        {table: dim_school, column: school_name}
  district:      {table: dim_school, column: district}
  student_group: {table: dim_student_group, column: group_name}
  school_year:   {table: fact_attendance, column: school_year}
Step 4 (Validate) Before anything is published, Datus runs automated checks. They catch the errors that silently inflate metrics.
PASS  grain_unique (violations=0)
PASS  orphan_school_keys (violations=0)
PASS  orphan_group_keys (violations=0)
PASS  join_fanout (violations=0)
A failed check sends the draft back to step 3. For example, join fan-out happens when a dimension has duplicate keys. It multiplies fact rows, so every sum becomes too large.
Step 5 (Human review) A data owner confirms each metric definition. Datus can propose a formula, but the business owns its meaning.
Step 6 (Compile and publish) The compiler turns a metric request into SQL. Asking for attendance_rate by district produces this query and result:
SELECT dim_school.district AS district,
       ROUND(100.0 * SUM(days_attended) / SUM(days_enrolled), 2) AS attendance_rate
FROM fact_attendance
JOIN dim_school ON fact_attendance.school_key = dim_school.school_key
WHERE is_suppressed = 0
GROUP BY 1
ORDER BY attendance_rate DESC
district | attendance_rate
Fresno Unified | 92.96
Sacramento City | 92.56
Oakland Unified | 91.88
San Diego Unified | 91.2
Los Angeles Unified | 91.04Changing the dimension to student_group needs no new SQL. The compiler picks the right join automatically.
Step 7 (Monitor) Datus watches for schema drift and unused metrics. When a source column changes, it flags the affected metrics before a dashboard breaks.
Where This Fits in Your Platform?
Run this workflow after the gold layer is built, and before dashboards are created. In a Microsoft Fabric project, the generated model can feed a Power BI semantic model. On other platforms, the YAML can drive a metrics service or a query API. The approach stays the same.
In Summary
A good model is not enough. People need one trusted definition of every metric, and they need it in business language. Semantic layer generation with Datus AI delivers this by inferring the schema, drafting the model, validating it automatically, and keeping a human owner in charge of meaning.
In our scenario, one YAML file replaced three competing calculations, and the same query now serves dashboards, analysts, and AI agents. Next, we will look at how Datus governs and monitors the platform once it is live.